3. Quick Start Guide
This chapter will give you a quick overview of the functionality of MQC and will show you how to use it to analyze your project quality and data.
Note
The Quick Start Guide is based on the sample data within a zip file
called MQC_QuickStart.zip. You can download the sample data here.
Please unzip this file to an appropriate directory for your sample data.
3.1. Start MQC
Start MQC by clicking on the TIBCO Spotfire icon.
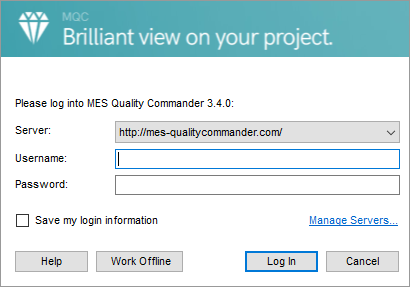
Figure 3.1 Start MQC and log in by entering server URL, user name, and password. Alternatively choose to work offline.
If you start MQC for the very first time, you must connect to the MQC server to receive or validate your license. Therefore, please enter the URL of your MQC Server (see Figure 3.1 above), user name and password and then log in. This will automatically provide you with the latest updates, bug fixes and other improvements.
3.2. Create new Analysis
To analyze and visualize your project data with MQC, first you have to create a new analysis. From the menu bar choose . (Please, always make sure to save your old project before starting a new analysis.)
Now you will be directly prompted to import your project data.
Select to add data from directories (see Figure 3.2). Then navigate to the folder where you have stored the previously extracted sample project data provided by MQC, choose the directory and commit your choice.
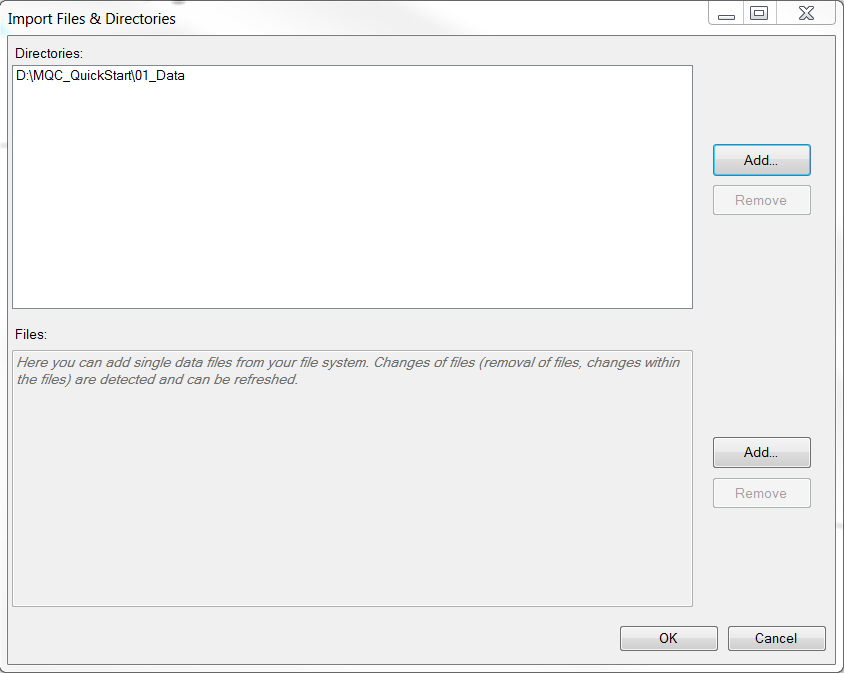
Figure 3.2 Import project sample data into MQC by adding the directory including the sample data
The directory (including all subdirectories) will be recursively searched for files that can be read by the MQC tool adapters (for detailed information on the supported adapters, please refer to Data Sources supported by MQC).
MQC now loads and transforms the data.
Changes inside the added directories (new files, removal of files or even changes within the files) are automatically detected and can be applied either manually or automatically if “Automatic Refresh” is enabled (see chapter MQC Configuration Panel).
3.3. Check Data Availability
The Data Availability page gives you a first overview of the imported data. This page helps you to evaluate, which of the data you expect to be collected from a particular data source actually is available respectively missing. Availability is shown per artifact, per data source and for the whole project (see Figure 3.3).
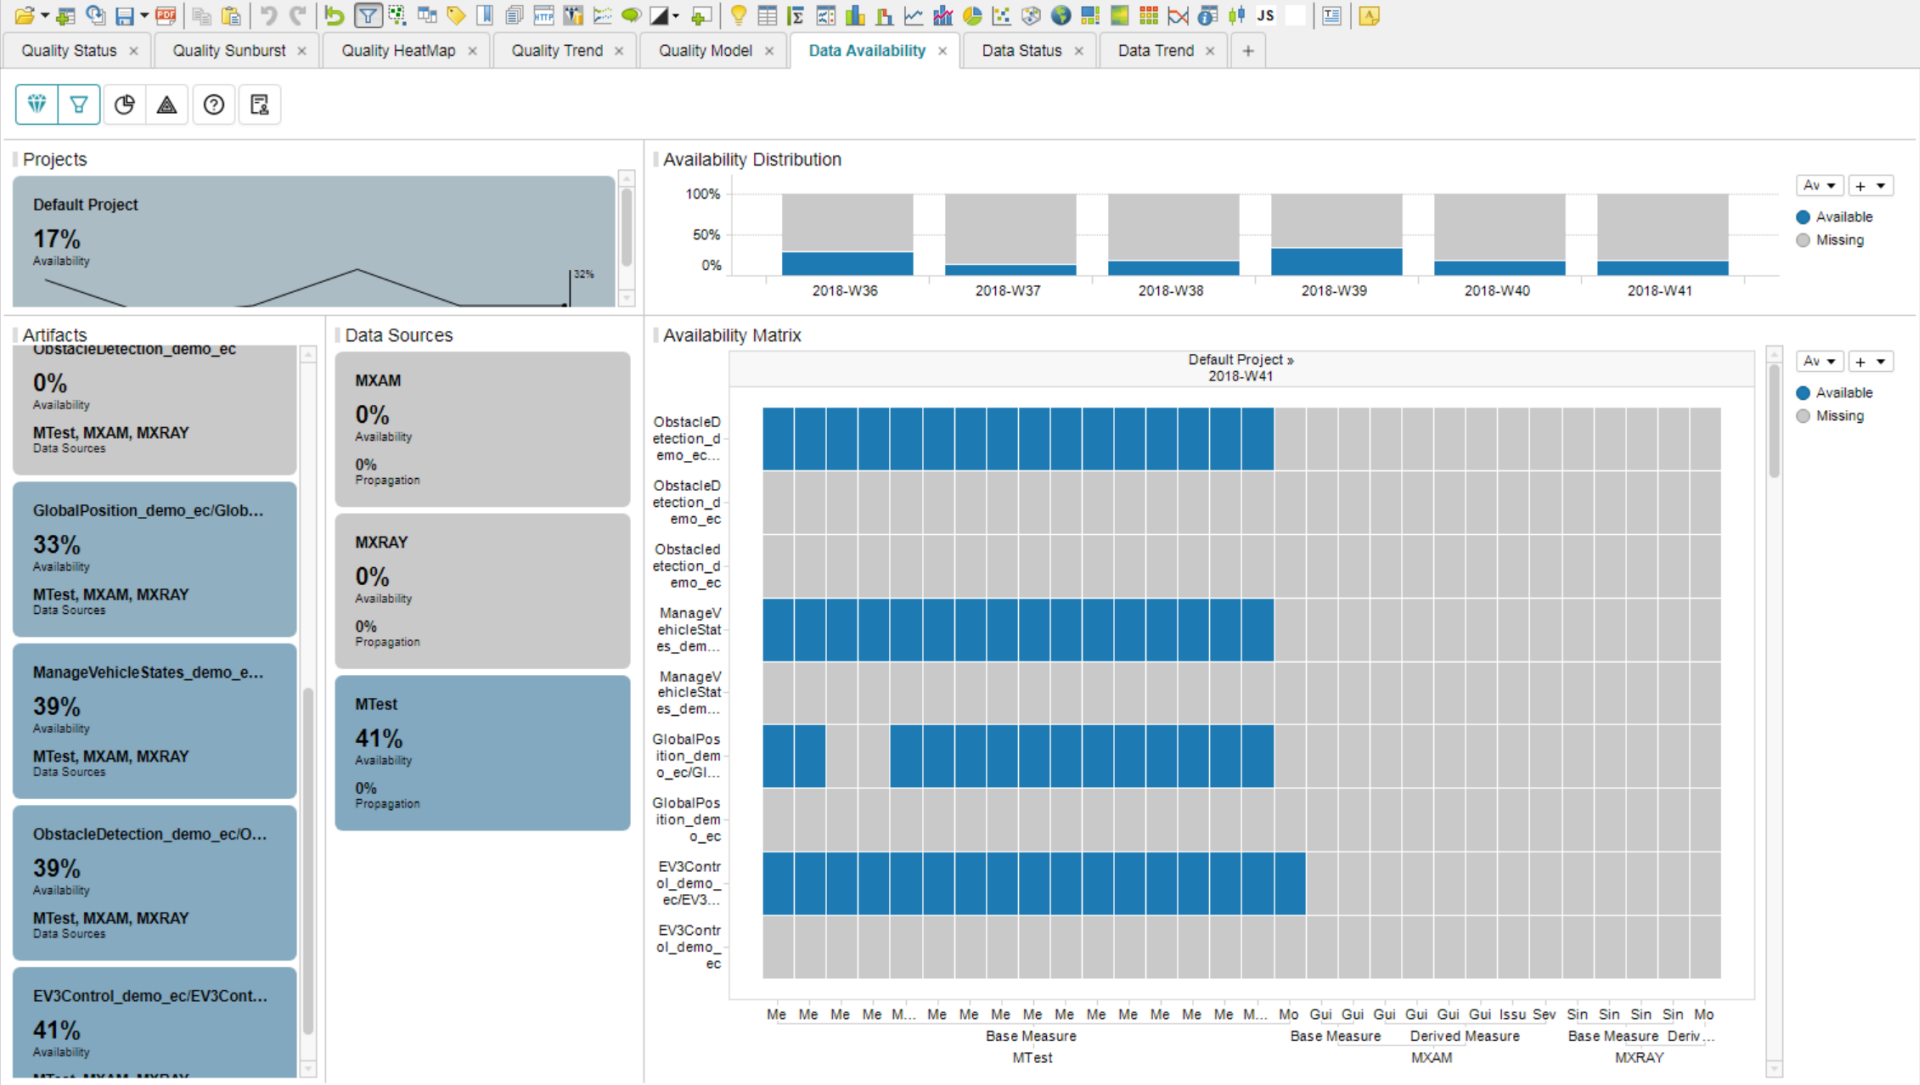
Figure 3.3 MQC Data Availability page showing the availability of the imported project sample data
Data availability can be checked per revision by scrolling from the last to the first revision in the Availability Matrix. Additionally, the Availability Distribution bin chart at the top of the page depicts for each revision the relative portions of available and missing data.
MQC uses a blue data coloring scheme on pages related to data. In context of the Data Availability page, this means you can easily distinguish between available data in blue and missing data in grey.
You may have noticed (by looking at the Availability Matrix visualization) that for each artifact there is only data available from one data source. Yet for other data sources there still appear grey (missing) tiles. In this particular case the reason is the used artifact naming, which can be adapted by loading some project configurations.
3.4. Import Project Structure
Until now, the names of the observed artifacts were taken as provided by the data sources itself. However, it may be the case that different tools collecting data and creating reports are using different names for the same artifact. Therefore, MQC provides configuration possibilities to map these different names to the same artifact name.
Please note, that the import of configuration files can be triggered via the MQC Configuration panel, which is visible at the top right side of the MQC working space. Per default the Configuration panel is enabled on all MQC data pages, but can be additionally enabled on other pages, too. Therefore, simply click on the Configuration panel button in the MQC tool bar.

Figure 3.4 Enable MQC Configuration panel via MQC Tool Bar, by clicking on the middle icon from the right (here highlighted in petrol)
From the MQC Configuration panel choose
and navigate to
the folder, where you have stored the sample project data. Choose the Project
Structures Excel file 01_ProjectStructures_Initial.xlsx and commit your
choice.
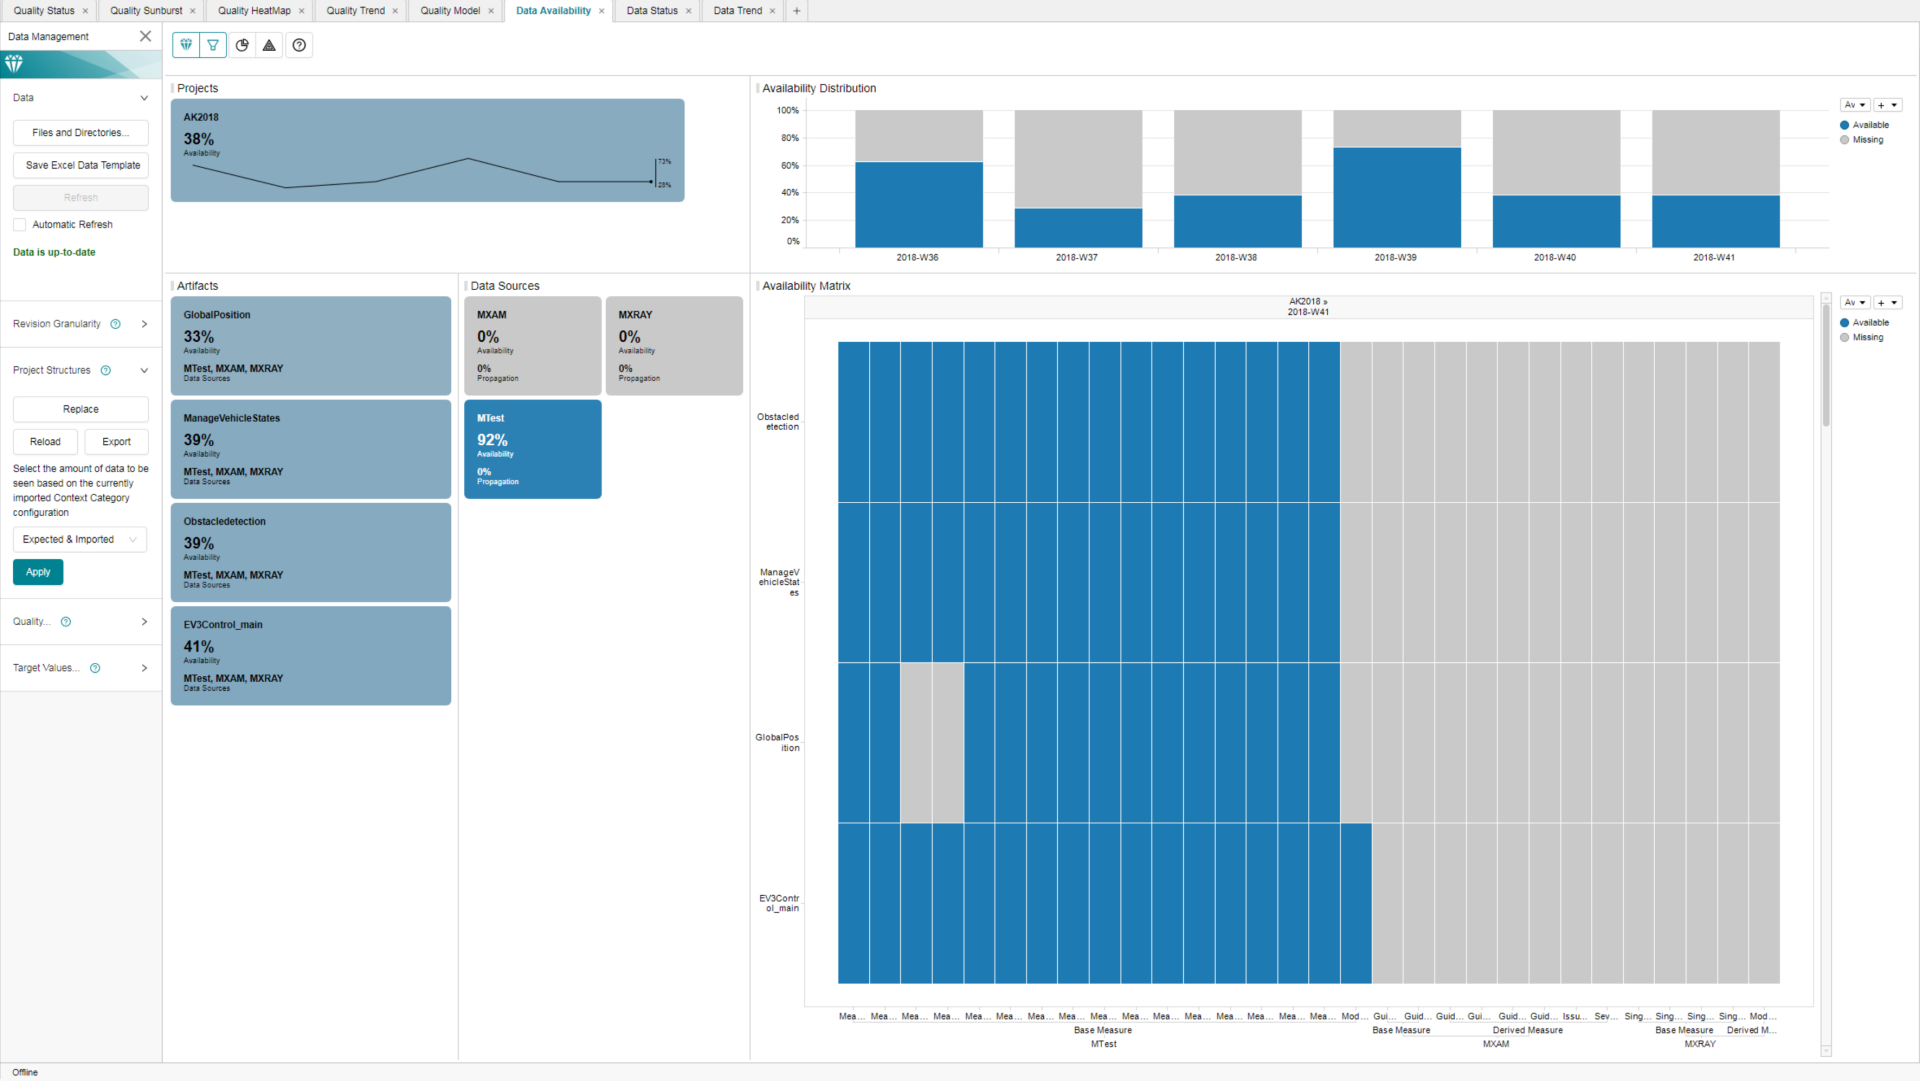
Figure 3.5 MQC Quality Availability page after importing project structures
As you can see, the number of artifacts shown on the left-hand side has been reduced. All loaded measure values are automatically assigned to the correct artifact according to the imported mapping defined in the Sample Project Structures file.
Additionally a dedicated name was chosen for the project, which now replaces the previously used “Default Project” and that is to be seen on the Project KPI tile in the top-left corner of the page.
For more details on structures and dimensions, refer to MQC Dimensions and Structures. For details on how structures and dimensions can be configured in MQC, refer to Configuration of Project Structures.
Now you can directly check the Data Status page.
3.5. Check Data Status
On the Data Status page you will find all available measure values for each of the observed artifacts.
To restrict your data only to the interesting information, you have two possibilities. On the one hand, you can select elements (in MQC called marking). When marking one or multiple elements, data that corresponds to elements not marked is excluded only from the main visualization. Please note that marking works cumulative. That means further marking without reset will again reduce the result set of the last selection. You can always reset your selections by clicking on the Project KPI tile.
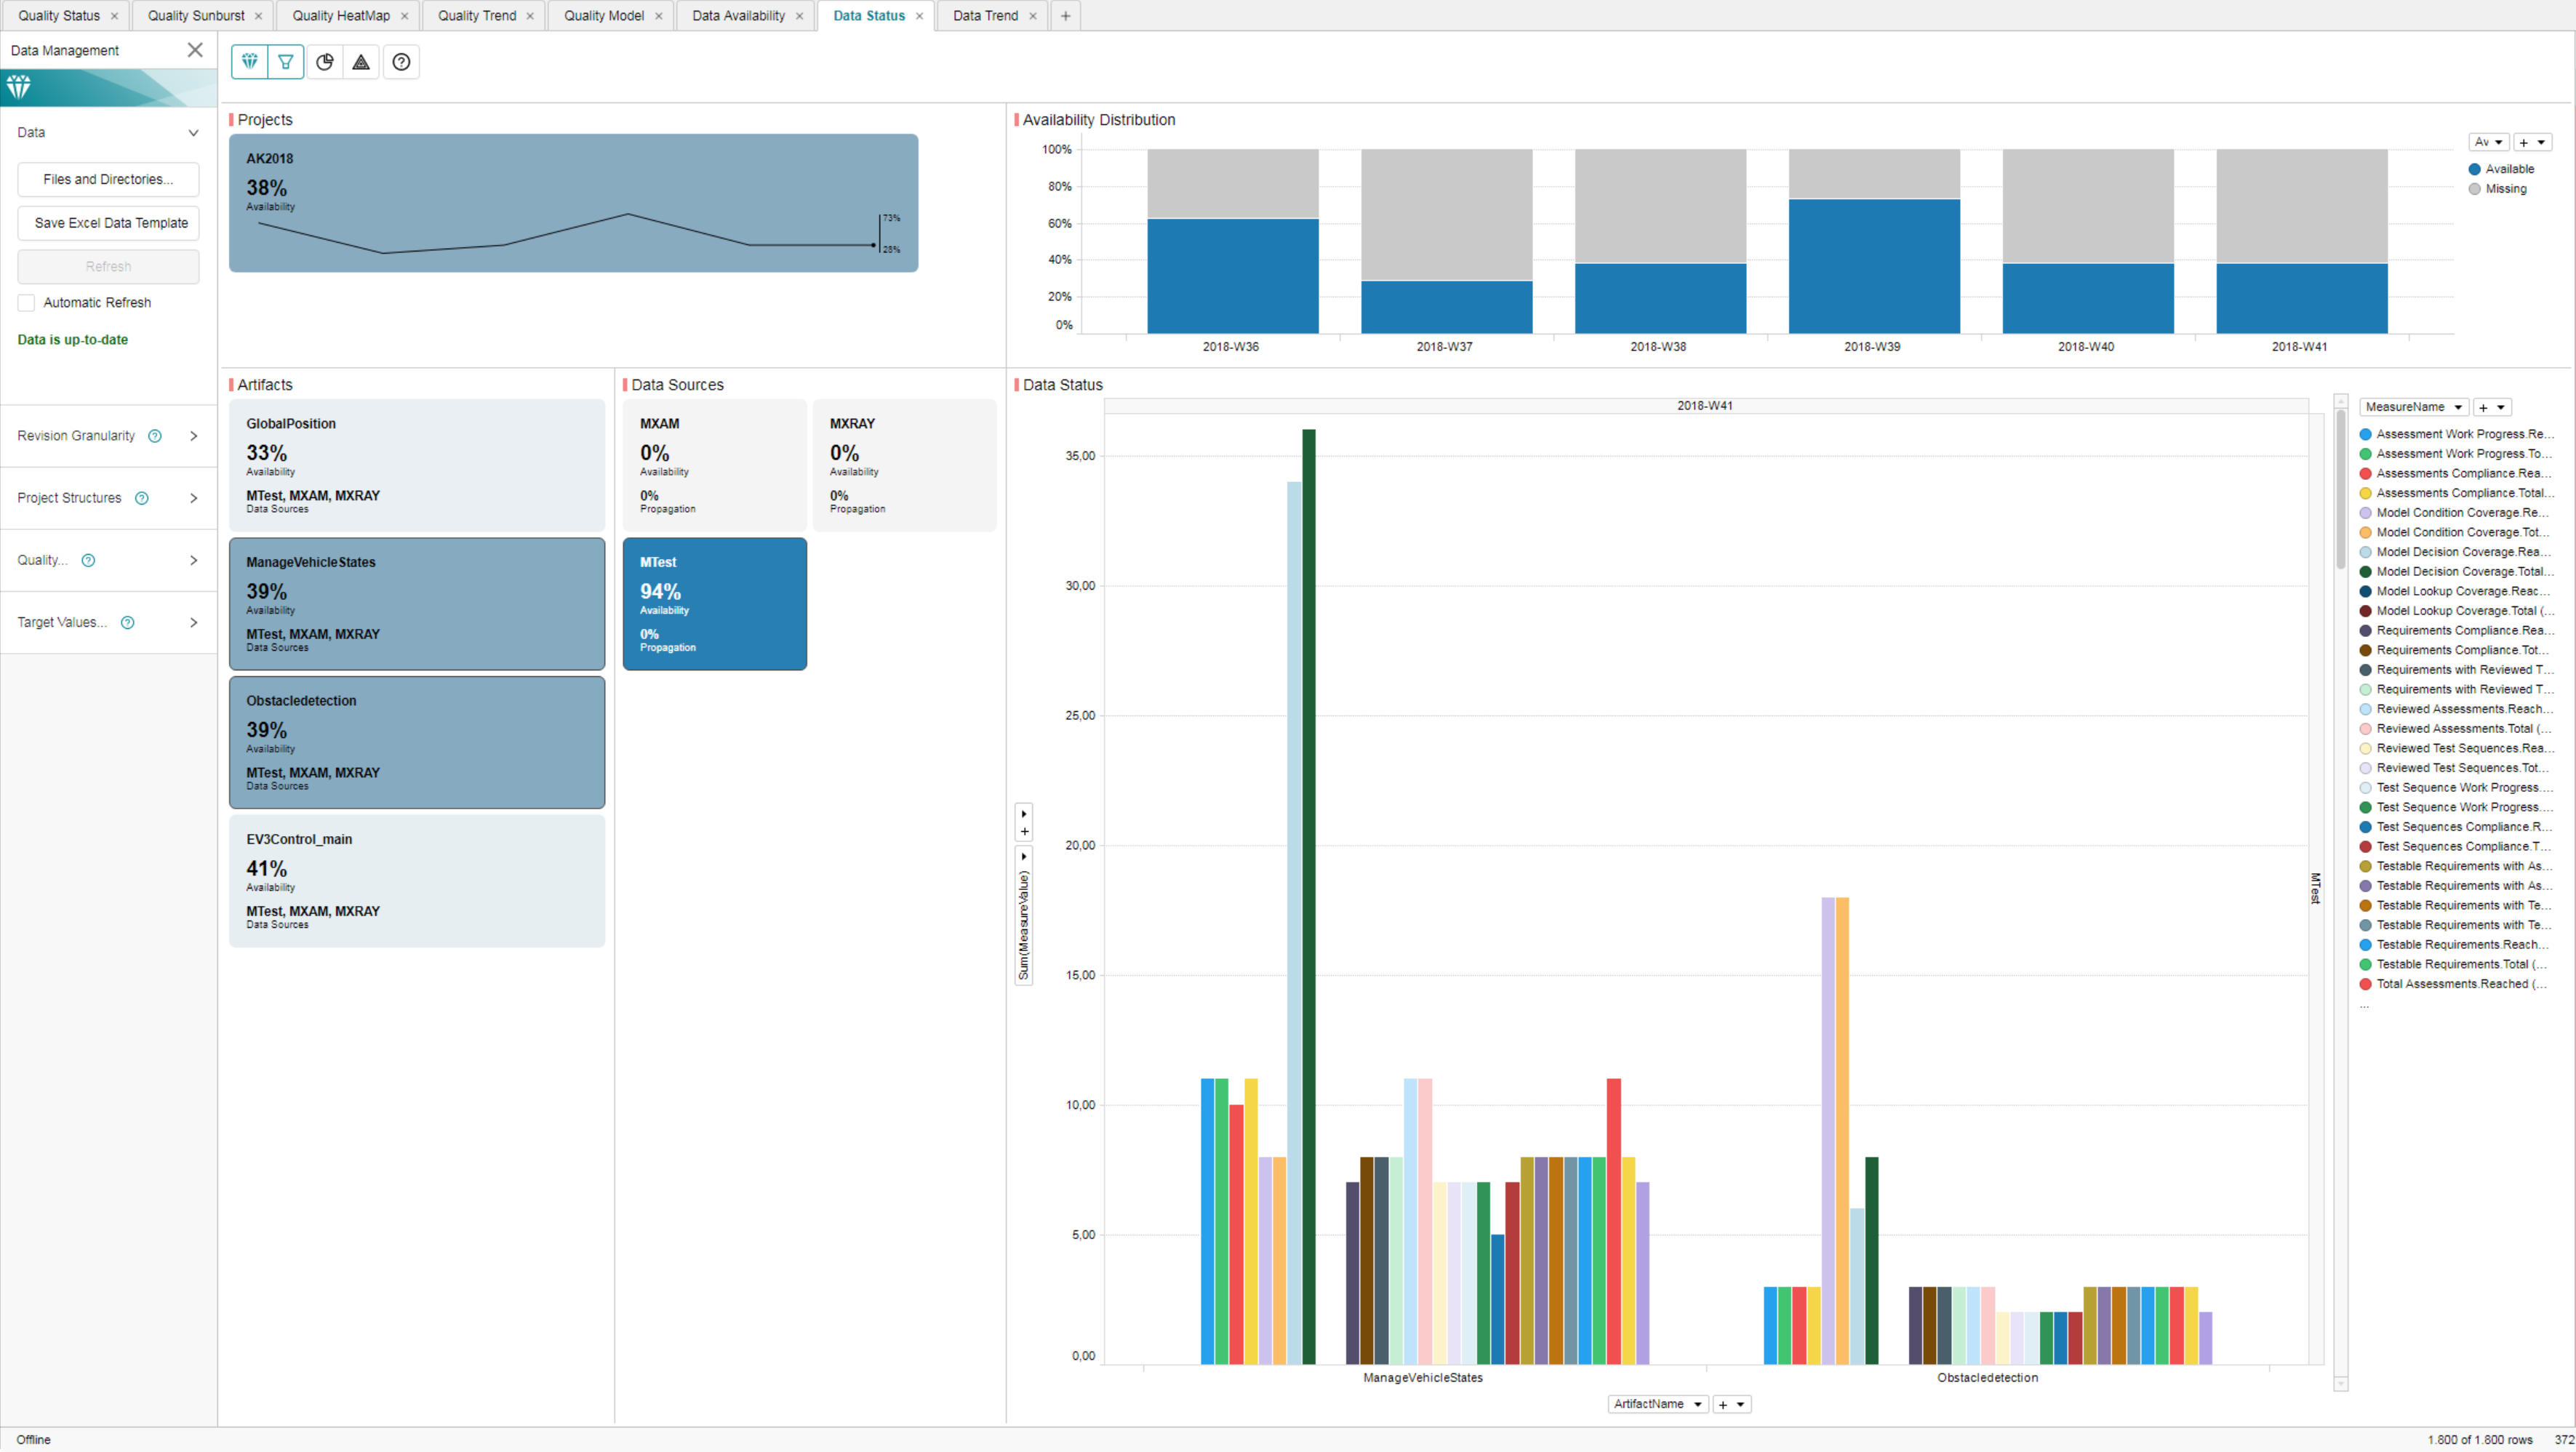
Figure 3.6 Using Marking on MQC Data Status page: The main visualization shows all base measures related to the selected Artifacts and Data Source (MTest)
On the other hand, you can apply filters for quick data discovery using the filter panel on the right-hand side of the page. All visualizations, bar charts and KPI’s will adapt to the selected filters. Remove the chosen filters by clicking the “Reset All Filters” button.
3.6. Import Quality Model
Before analyzing the quality that is computed from the available data, you should first import a Quality Model that fits to your collected measures and that defines how quality should be calculated for your project.
From the MQC Configuration panel choose
and navigate to
the folder, where you have stored the sample project data. Choose the Quality
Model Excel file 02_QualityModel_Initial.xlsx provided by MQC and commit
your choice.
Typically, a Quality Model defines a number of quality properties and corresponding measurement functions, which use your imported project data to calculate quality values for the defined properties. For more details, please refer to the explanation of The Quality Model and Configuration of Quality Model, respectively.
After you have finished importing the Quality Model, MQC calculates quality. You may now check the Quality Trend page.
3.7. Check Quality Trend
The Quality Trend page gives you an overview on how the quality of your project has evolved over time. A quality trend is shown for each of the observed artifacts as well as for every quality property defined by the imported quality model.
The quality for each quality property is calculated from the imported measure values using a measurement function defined in your quality model. For more information, please refer to the definition of Quality Properties.
A Quality Bin Distribution chart depicts for each revision the relative portions of quality properties with good, acceptable and bad quality.
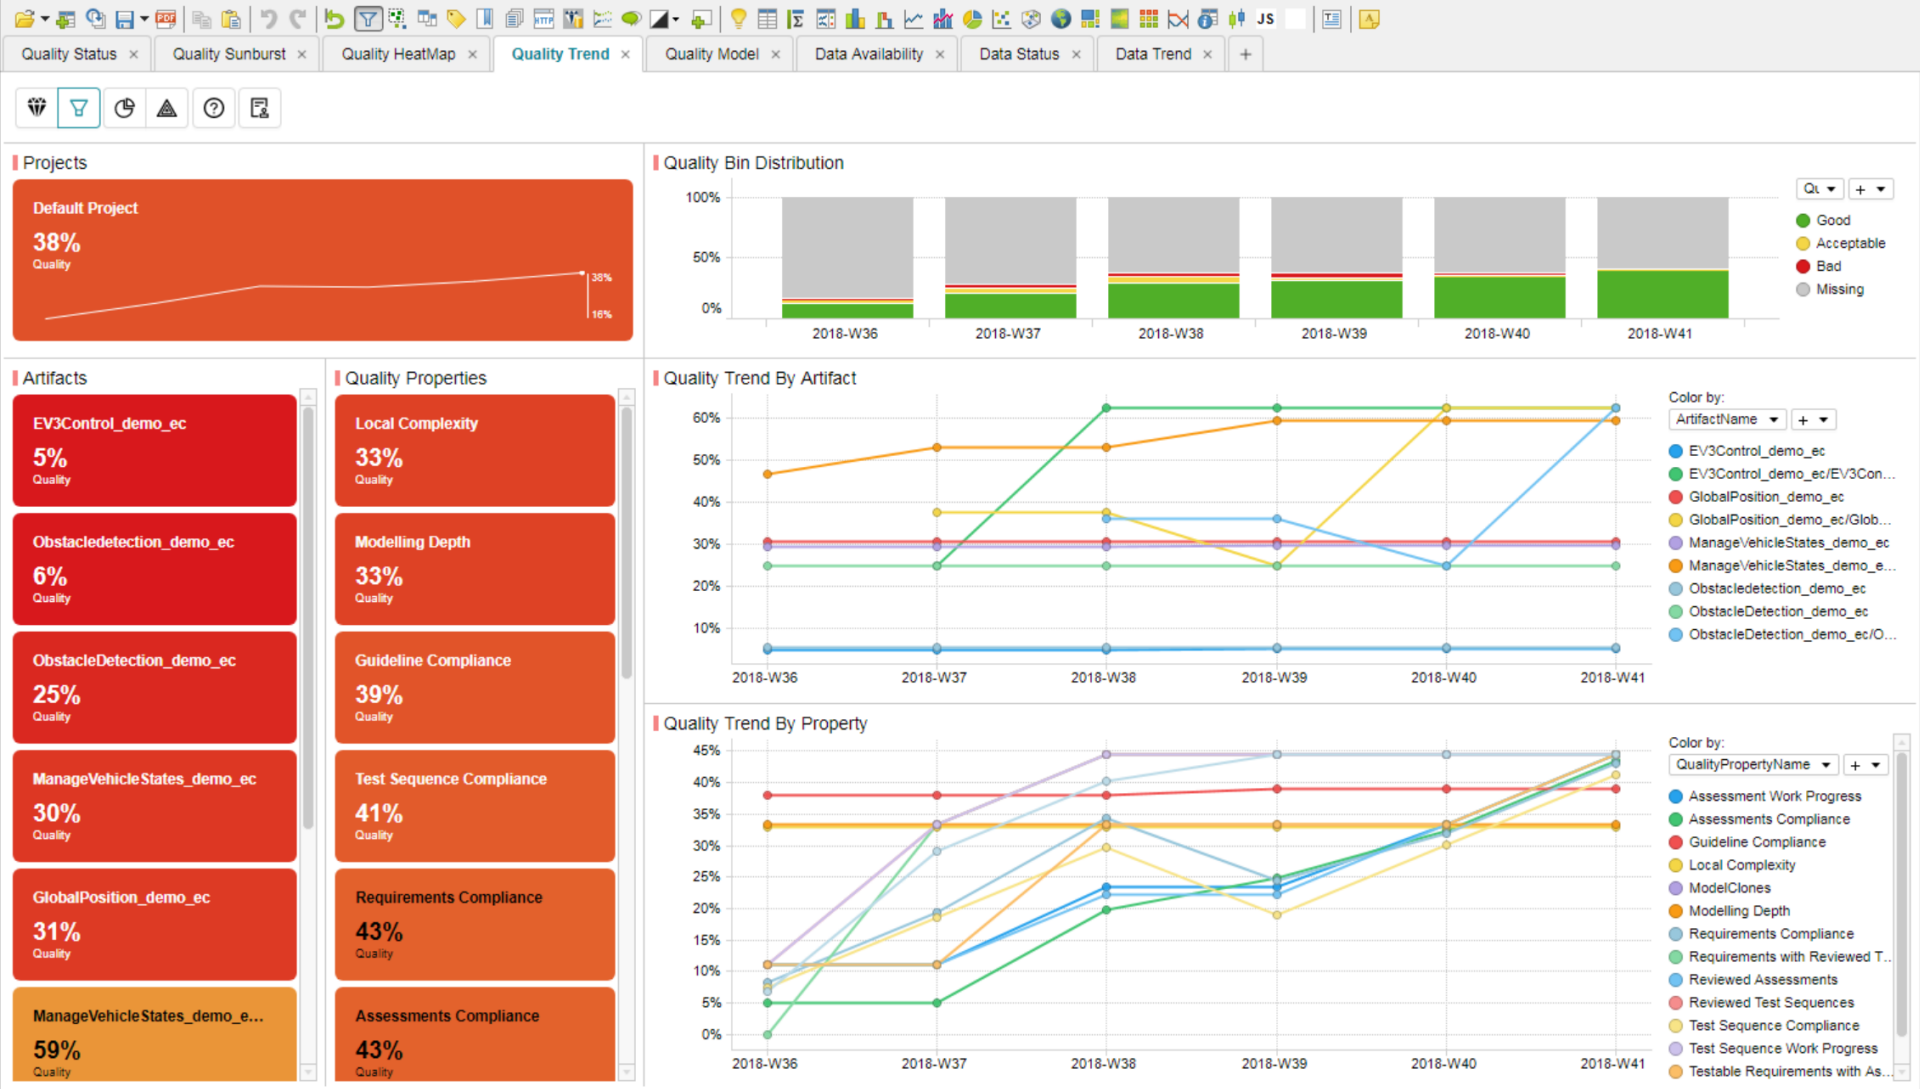
Figure 3.7 MQC Quality Trend page showing the evolution of project quality over time based on revisions
Quality is visualized using a traffic light coloring scheme, i.e. green for good quality and red if the computed quality is bad. Therefore, you can easily detect problems, i.e. those parts of your project with insufficient quality.
To focus on specific information only, you may select on the left-hand side a single or even multiple artifacts as well as one or more specific quality properties. Thus, the number of trend lines shown in the main visualization is reduced based on your selection.
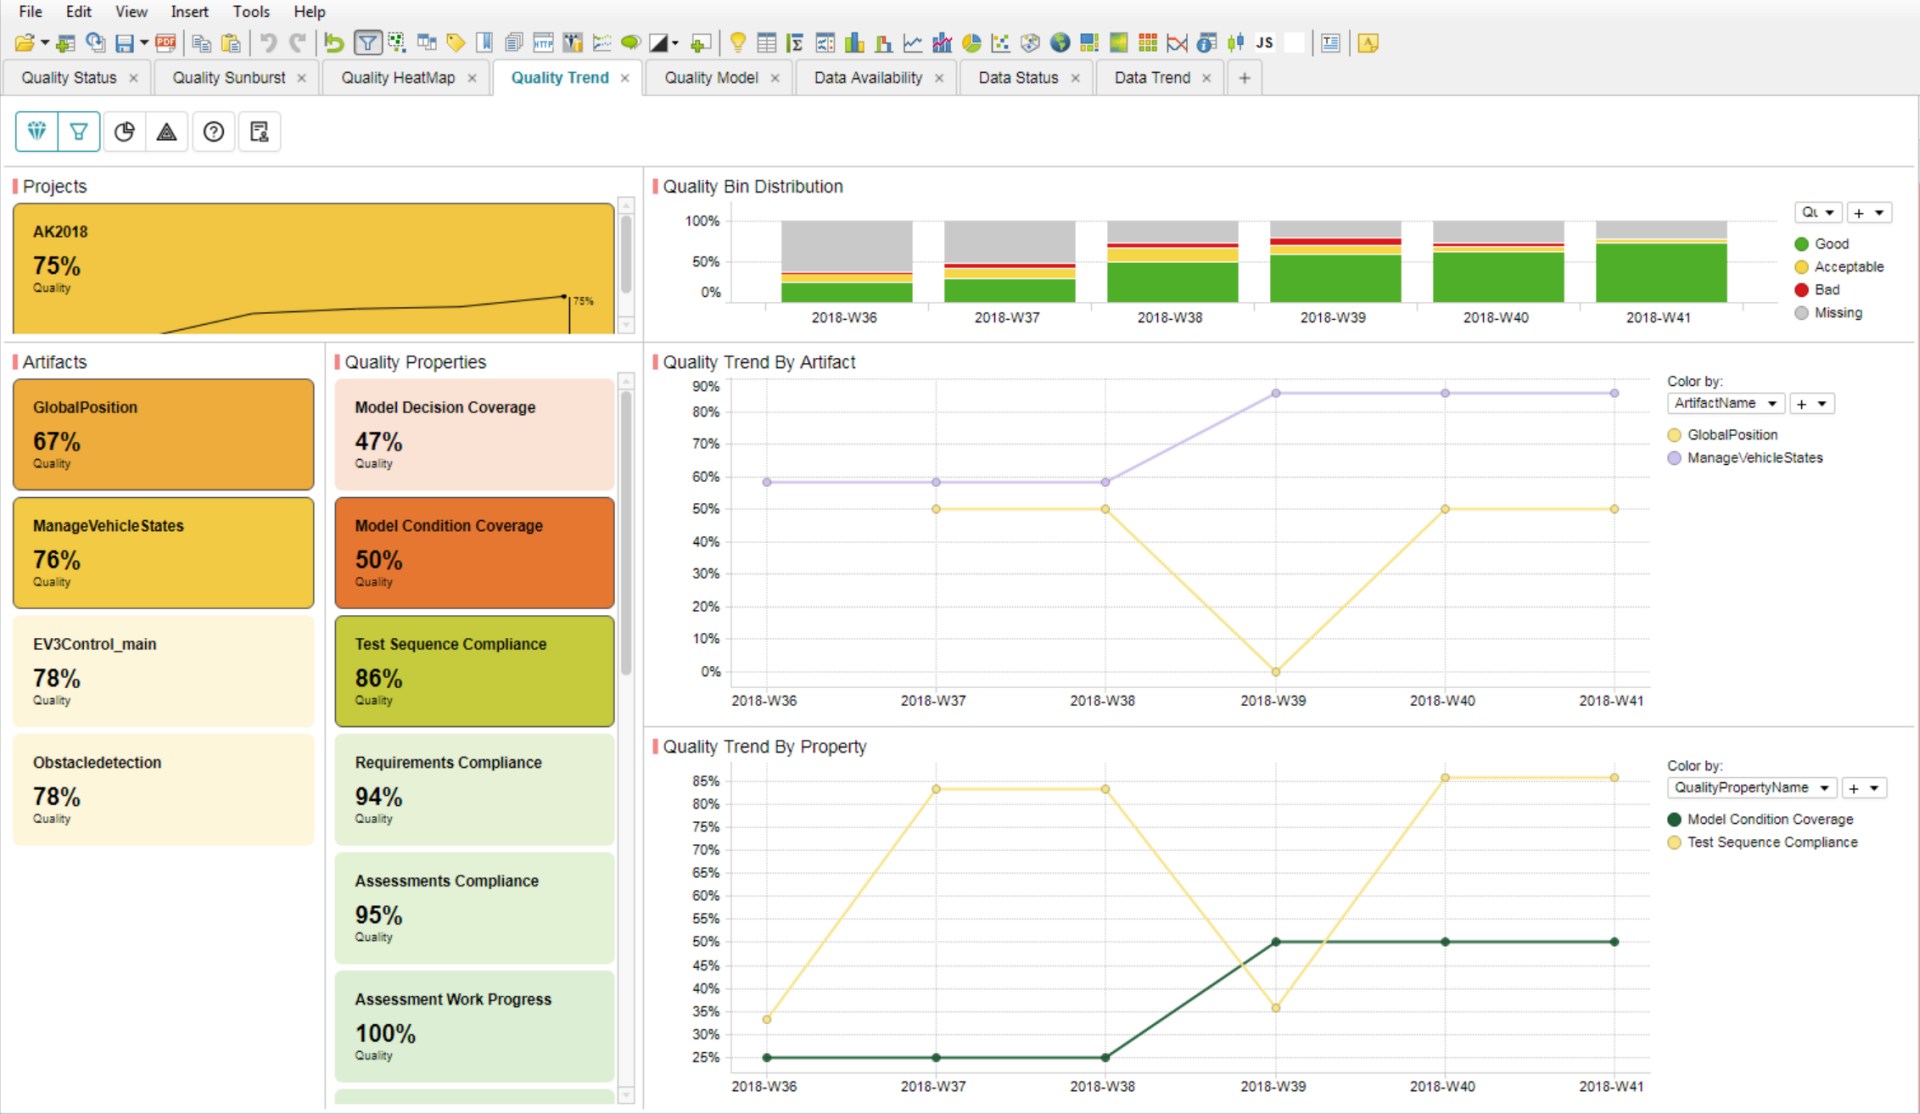
Figure 3.8 MQC Quality Trend page just showing Artifact and Quality Property Selection
Still, each artifact trend line shows an aggregated result based on all contributing quality property measure values. The same applies to each quality property trend line.
If you are interested in quality per property and artifact, please switch to the Quality Status page.
3.8. Check Quality Status
The Quality Status page provides you detailed information on the calculated quality. Here you can check quality for each of the artifacts separately resp. for each quality property per artifact at a certain point in time.
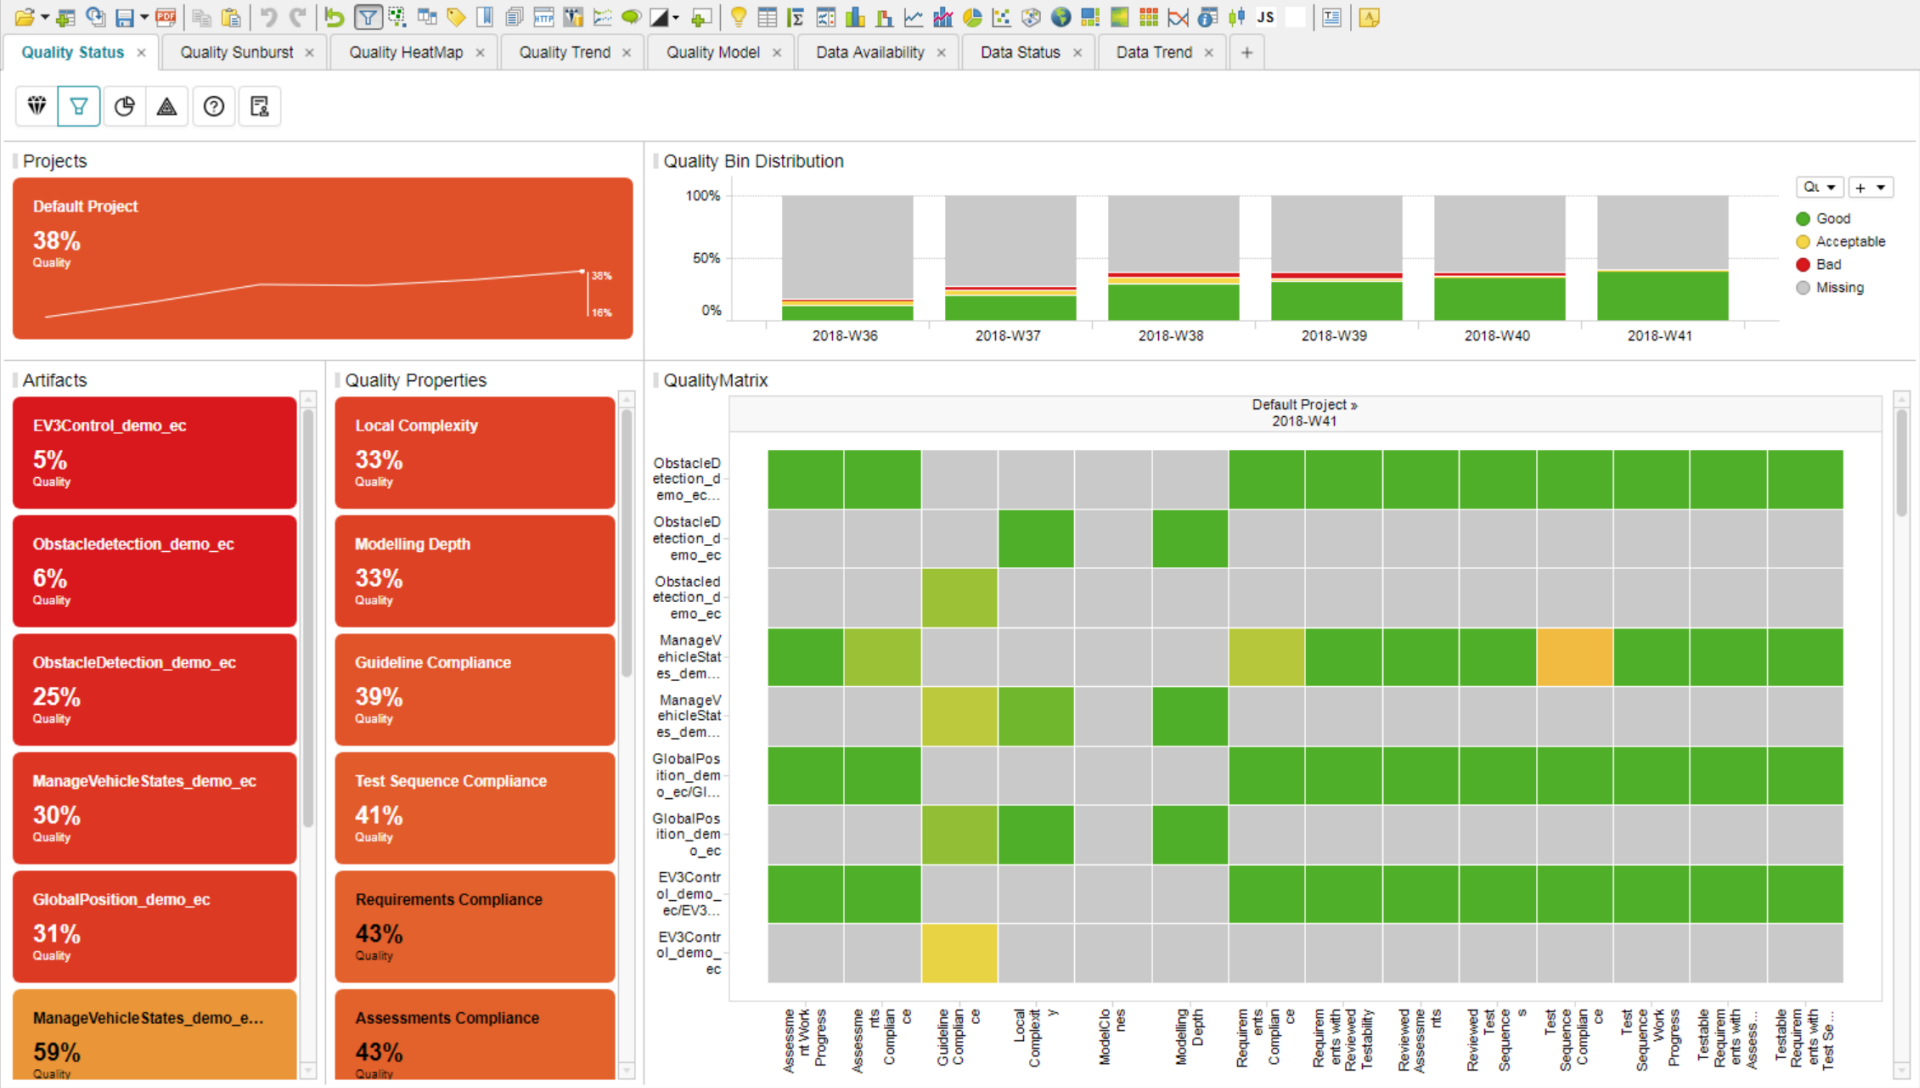
Figure 3.9 MQC Quality Status page showing detailed quality information per quality property and artifact
The quality matrix shown in the main visualization window of this page can be used to gain information about a particular quality property for a certain artifact.
Grey areas inside the Quality Matrix indicate missing quality properties, which means the data used to calculate the quality property is not available for that particular revision. This is due to the fact that data sources (tools) provide data at different times. In our case for example MXAM and M-XRAY data is not available for the last revision but for earlier revisions only.
Please note, that if for a particular revision a specific measure value is missing but was imported for any of the previous revisions, MQC offers a propagation feature. On one of the data pages mark the missing data bin within the desired revision or mark the Project KPI tile, then right click and choose . This will copy previously collected data to later revisions to gain a full set of available information (refer to Data Propagation for more details).
3.9. Work with MQC
Following the steps described in the previous sections, you should gain a general overview about the main MQC pages and visualizations.
As you may have noticed, all pages use a common layout. A Project KPI on the top-left always informs you about the overall quality respectively data availability of your project including a trend visualizing the progress over the past revisions. On the right-hand side of the Project KPI, you will always find a revision based bin chart, where each bin shows relative portions of certain sets of elements compared to other sets, i.e. available data vs. missing data or good quality items vs. bad quality items.
On the left-hand side a list of selectors is available, which enables you to reduce the displayed information, e.g. by selecting one or multiple artifacts, quality properties or data sources.
Each page contains a main visualization window, where you can find all necessary information regarding project quality resp. data availability, and which always reflects your selections previously done.
You can now start identifying the reason for bad quality. The general concept of detecting issues is to click on (or hover over) red quality bins or tiles. At the Quality Status page select a bad, i.e. red quality bin from the Quality Bin Distribution chart at the top.
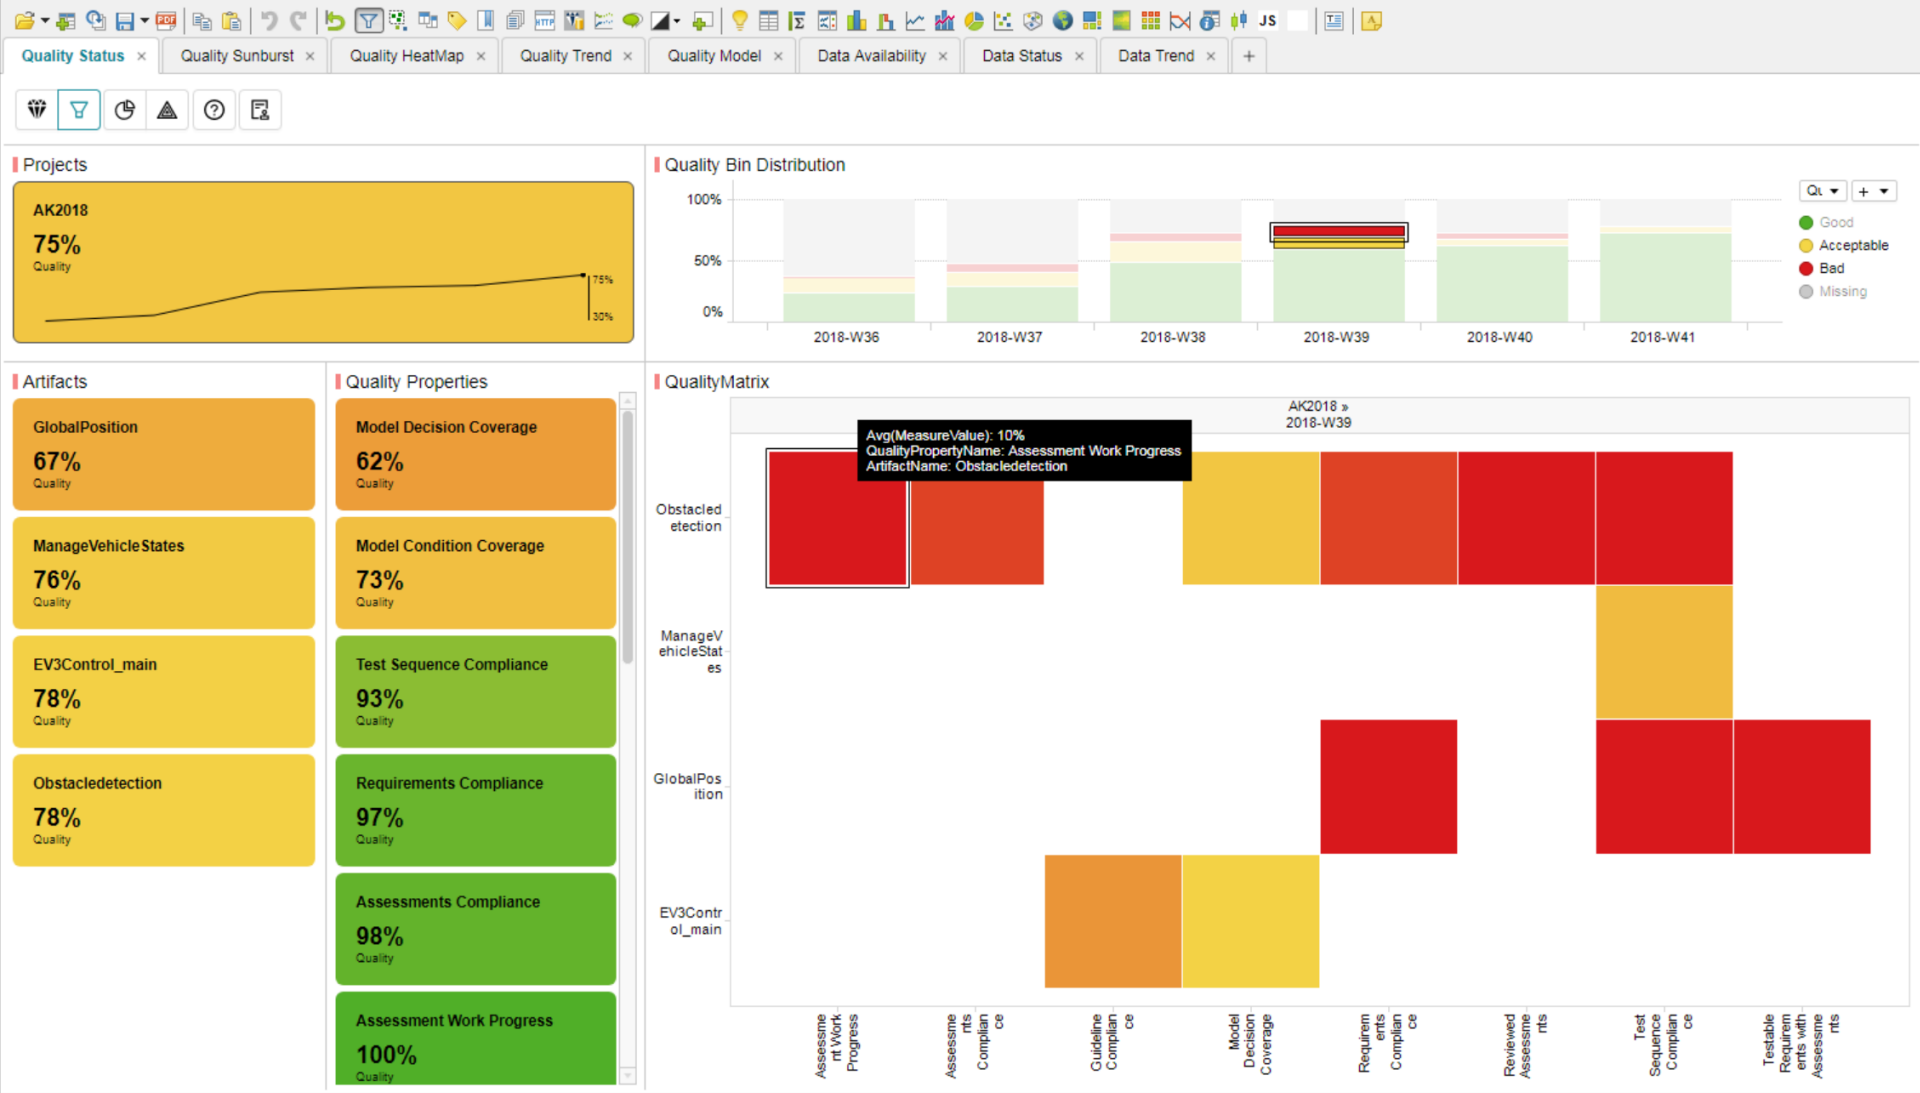
Figure 3.10 MQC Quality Status page after marking a bad quality bin to reduce the main visualization to quality properties with bad quality
The main visualization window immediately shows you all quality properties with an insufficient quality per artifact. By hovering over the tiles, you will get detailed information about particular quality properties, for example the concrete quality measure value.
Select a particular (or various) tile(s) inside the QualityMatrix (for multiple selection hold STRG and left click). Then right click on it (them) and choose from the context menu as shown in Figure 3.11.
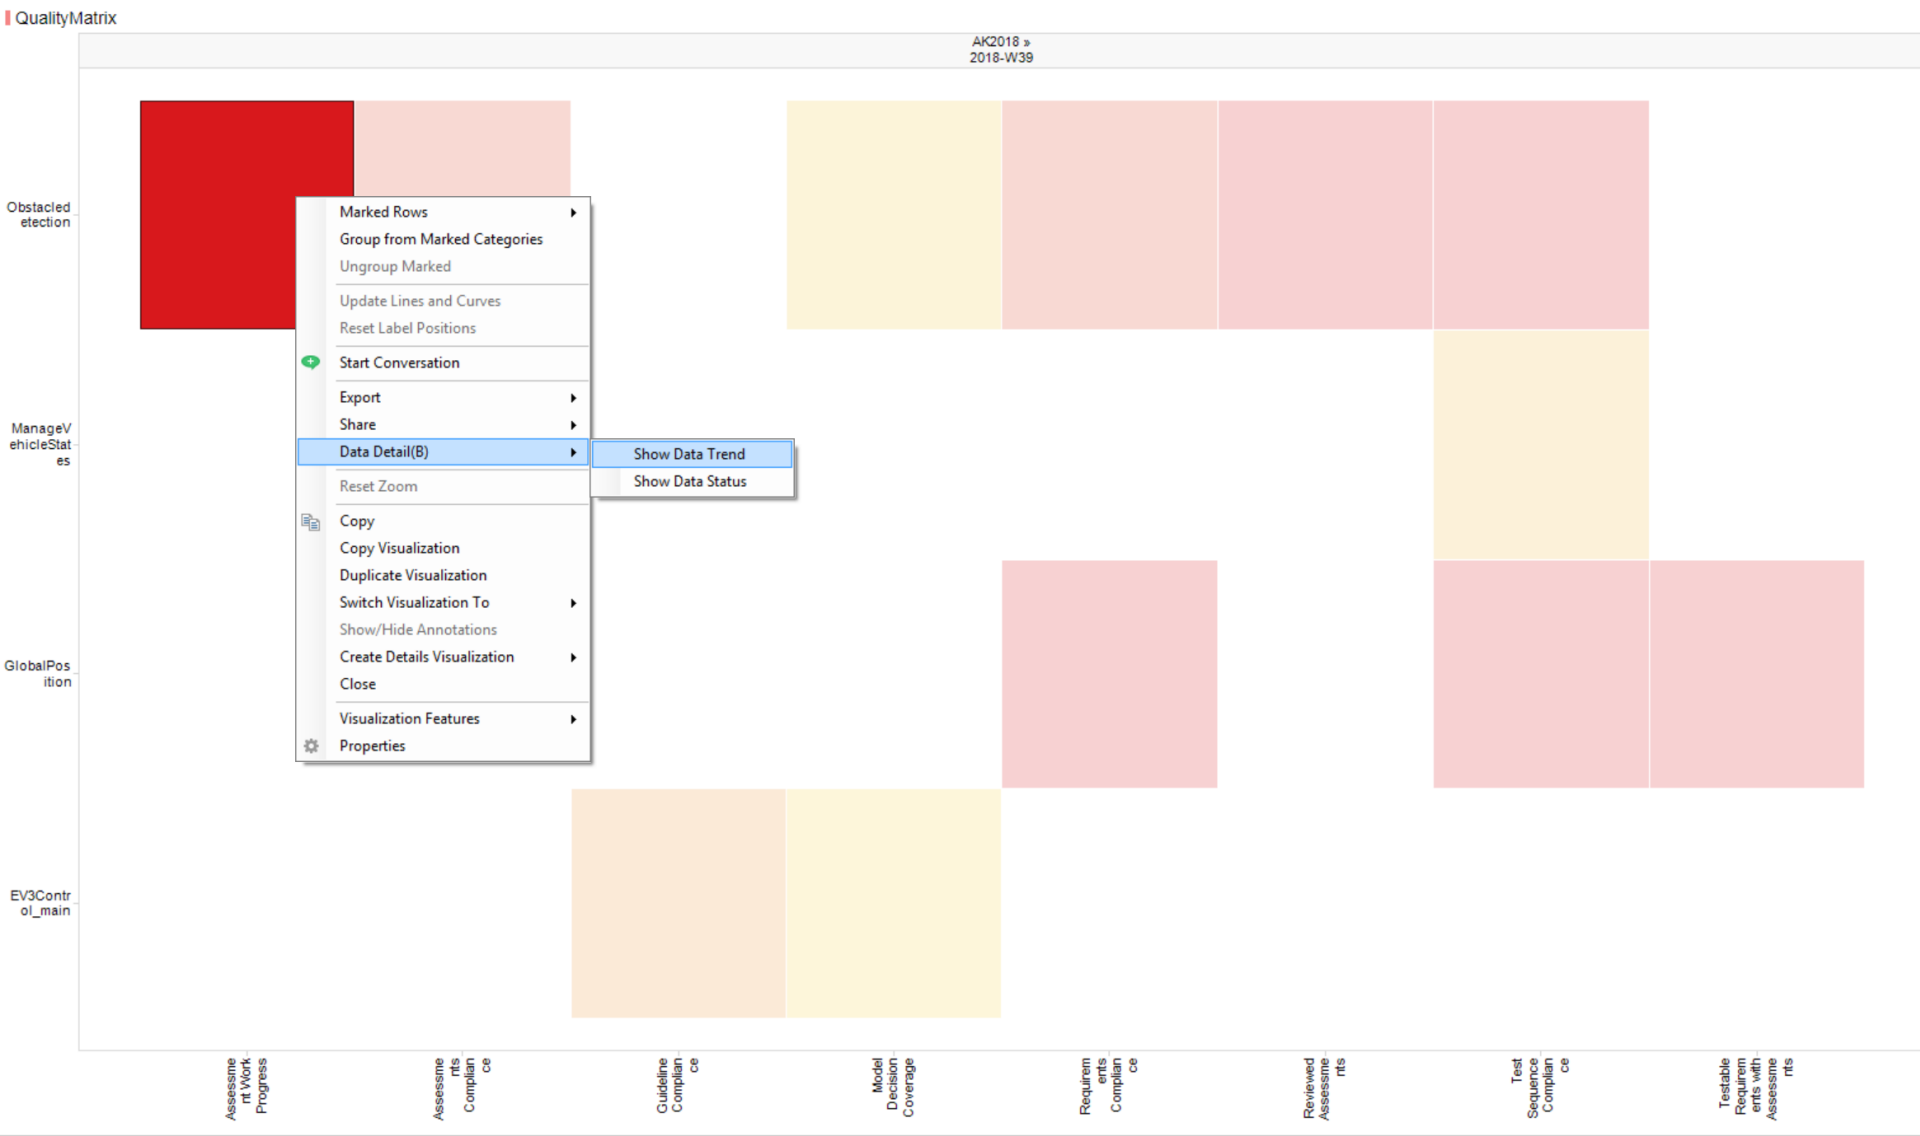
Figure 3.11 Select a bad quality tile within the Quality Matrix and use context menu to show Data Details for this Quality Property
MQC directly switches to the Data Trend page and reduces the visualization to those base and derived measures that were used to calculate the selected quality property.
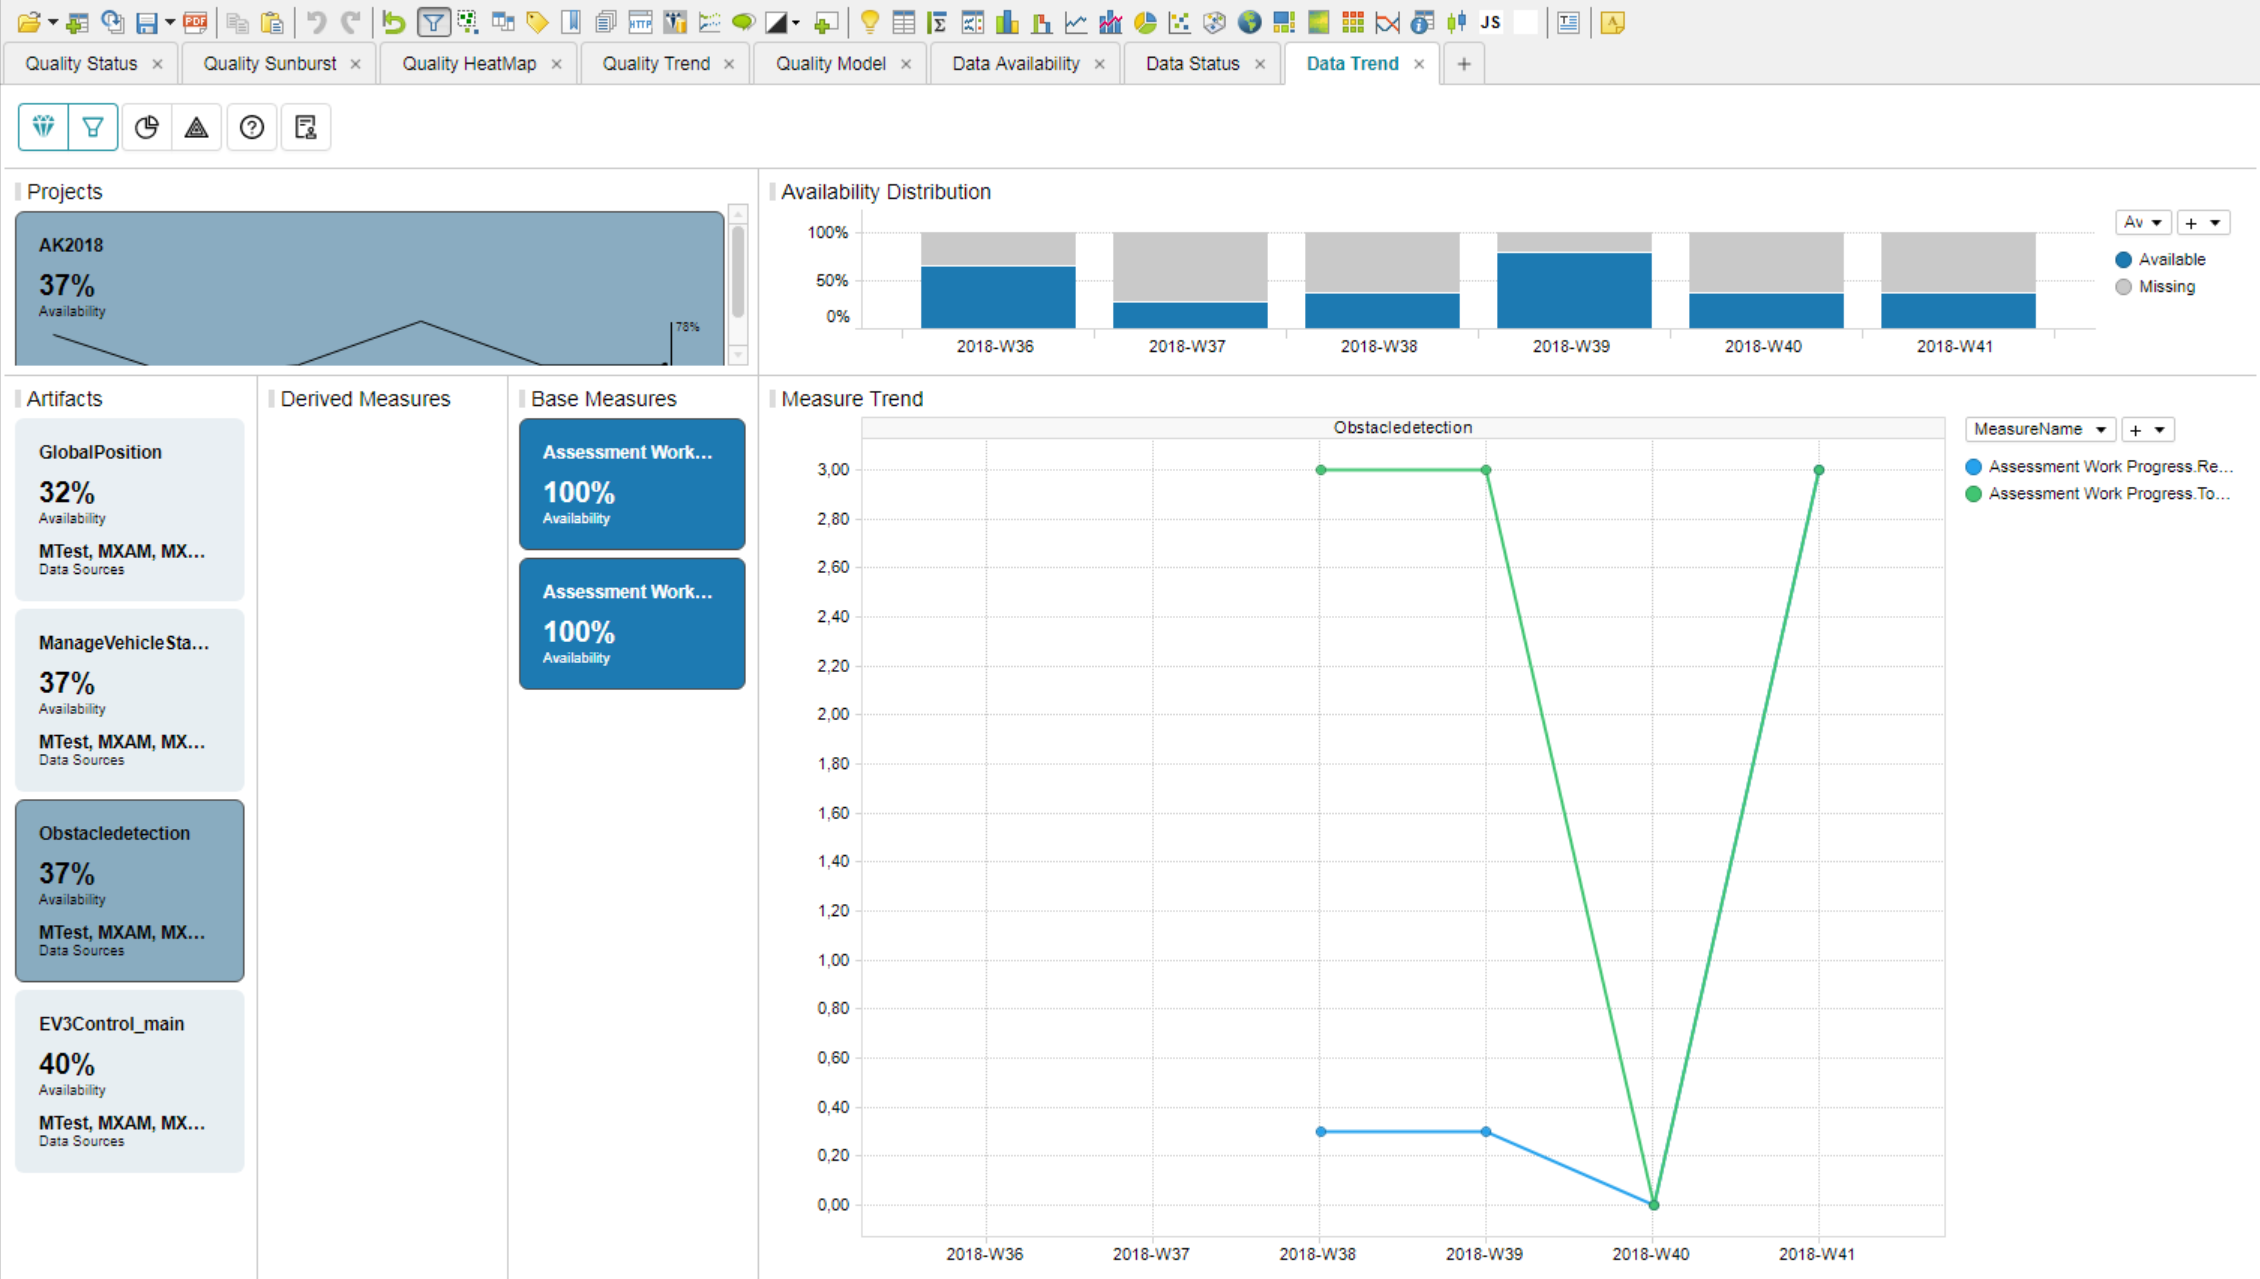
Figure 3.12 MQC Data Details View showing Base and Derived Measures used to calculate selected Quality Properties
Alternatively you may also choose from the context menu to switch to the Data Status page.
For more details on the MQC Drill Down functionality, please refer to Data Details Drill Down.
At the end, with the possibilities offered by MQC, you can easily identify those parts of your project having problems and which may require further activities to improve quality.