17. MQC Configuration Panel
17.1. Importing Data
In MQC data can be imported easily by means of the Configuration Panel. You can activate it by clicking at the MQC diamond icon at the top right side of the MQC working space (see Figure 3.4)
Either you can import single files or directories (see Figure 17.1).
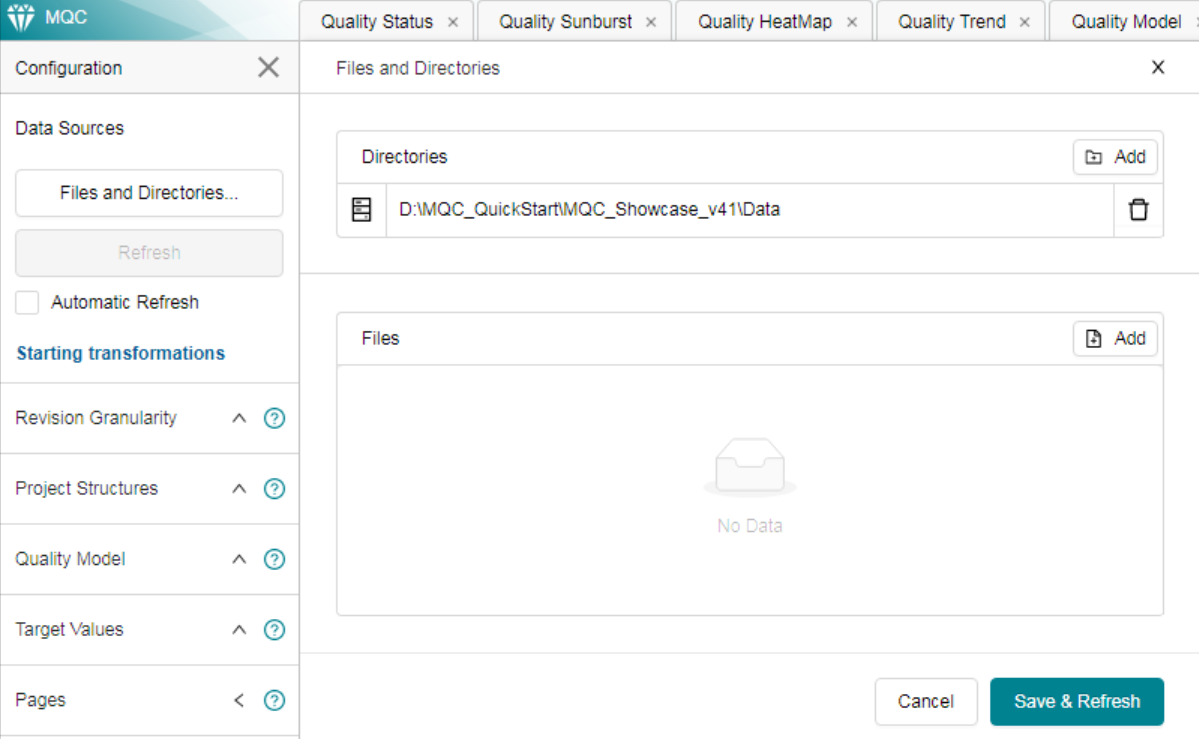
Figure 17.1 Click on Files and Directories… Button of the Configuration Panel and select the directory that contains your file reports, e.g. our example data that was delivered to you in section Quick Start Guide.
Once you have specified a directory by clicking on Save and Refresh,
you can gradually import your file reports by copying new
files / directories into this indicated directory by using
Windows Explorer or any other Commander. To consider your newly added
files/directories, press the “Refresh” Button.
Alternatively, you can press the Automatic Refresh checkbox, so that MQC refreshes the specified directory every second and searches all files and subdirectories recursively to load those new file reports into your MQC Project Collection.
The most recent selected directory will be used for the Refresh. Note that on deleting any files from this directory, MQC removes the data from the project. However, previously imported data from other directories or files are unaffected.
Changes inside the added directories (new files, removal of files or even changes within the files) are automatically detected.
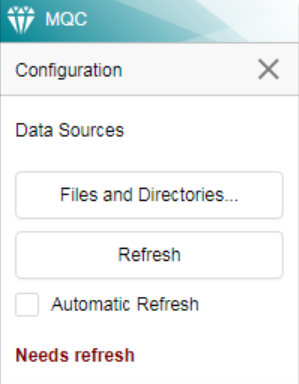
Figure 17.2 The “Needs refresh” status message appears due to changes within the monitored directories.
When clicking on the Refresh button the message will switch to the “Data is up-to-date” status message of Figure 17.1. Alternatively, if you don’t want to refresh your project manually you can also enable the checkbox with the “Automatic Refresh”.
17.2. Revision Granularity
The Revision Granularity can be used to change the degree of compactions of the revisions for that data exists to better visualize your trend line charts. The revision granularity can be selected depending on the needs via MQC Configuration Panel to select Revision Granularity (see Figure 17.3).
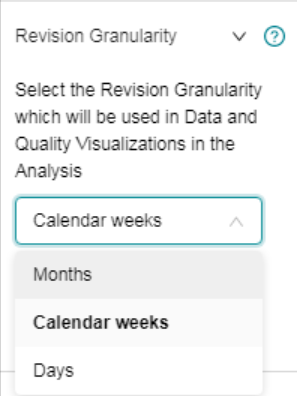
Figure 17.3 The default revision granularity is CalendarWeeks, but it might be useful to change it to Days or Months
For more details regarding the show empty revisions functionality, please refer to section Project Milestone Structure.
17.3. Quality Calculation with and without available values
In data integration routine, data might not always be completely available. Therefore, MQC provides to switch between two different ways to calculate quality (via Configuration panel ). By default the checkbox is unmarked, which means that quality is calculated out of all (available and expected) measures. If data for many base measures is missing to calculate the respective quality properties, it implies that overall quality is rather low although it might be high for those artifacts for that data is available. By marking the checkbox, MQC is able to exclude empty values out of quality computation to give a realistic overview of your project’s quality just with existing data.
17.4. Quickly editing data and importing File Data
Please note, that always when new files are available in the directory you imported, MQC will load this data automatically into your Project.
If you want to create a new MQC Project Collection with Excel data, please read Manual data import).
Alternatively, you can import data from new directories or files via , see Importing Data.
17.4.1. Import quality model and derived measures
Via the Configuration Panel, you can export an Excel file containing one sheet for the quality model and another sheet for derived measures. First, go to within the Configuration panel. You will then receive an Excel file containing the existing quality model and the derived measures (the sheets will only contain the MES default quality model if nothing further has been defined). Please refer to Configuration of Quality Model for more information with regard to the configuration of the quality model.
Before importing your own quality, You can edit the Excel file to define derived measures and the quality model, for example to extend it by an extra row that describes a derived measure.

Figure 17.4 Editing derived measures
Whenever you want to compute additional measures out of original data, you can use the derived measure concept. Define derived measures in order to be able to visualize the trend of derived measure and to simplify your quality computation (see below). The column Derived Measure Description is optionally, you can use it to add a description of the derived measure and to document changes, respectively.
Please note that the correct syntax must be used for the “Measure Function” column in order to define a valid derived measure:
Define mathematical expressions using [Measure.Variable] and
[Derived Measure Name] as operands. We recommend the Spotfire user manual
for a whole description of the iron python scripting language. The “usual”
operations can be used, for instance sqrt(), Abs(), +, -,
\*, /; but also aggregation methods or whole columns, for instance
Avg([Column Name]), Sum([Column Name]).
You can use the derived measures and the variables in order to define the measurement function for a quality property.

Figure 17.5 Editing the quality model
The column Quality Measurement Function shall consist of the function that you would like to use in order to compute quality measures for all artifacts for which the data used in the measurement function is available. The Quality Property Status column can be used for your internal documentation of the status of the quality property. This is an optional column. In addition to that, the Quality Property Description column can be used for documentation. For instance, you can provide the meaning of the measurement function. You can also use it for documentation of changes. Please note that both columns, Quality Property Status and Quality Property Description will be imported to MQC and the content will be visible on suitable dashboards.
Please note that the correct syntax must be used for the “Quality Measurement Function” column in order to define a valid derived measure:
Define mathematical expressions using [Measure.Variable] and
[Derived Measure Name] as operands. We recommend the Spotfire user manual
for a whole description of the iron python scripting language. The “usual”
operations can be used, for instance sqrt(), Abs(), +, -,
\*, /; but also aggregation methods or whole columns, for instance
Avg([Column Name]), Sum([Column Name]).
The further columns are used in order to define the structure of the quality model. The structure of the quality model has an impact on the overall quality measure.
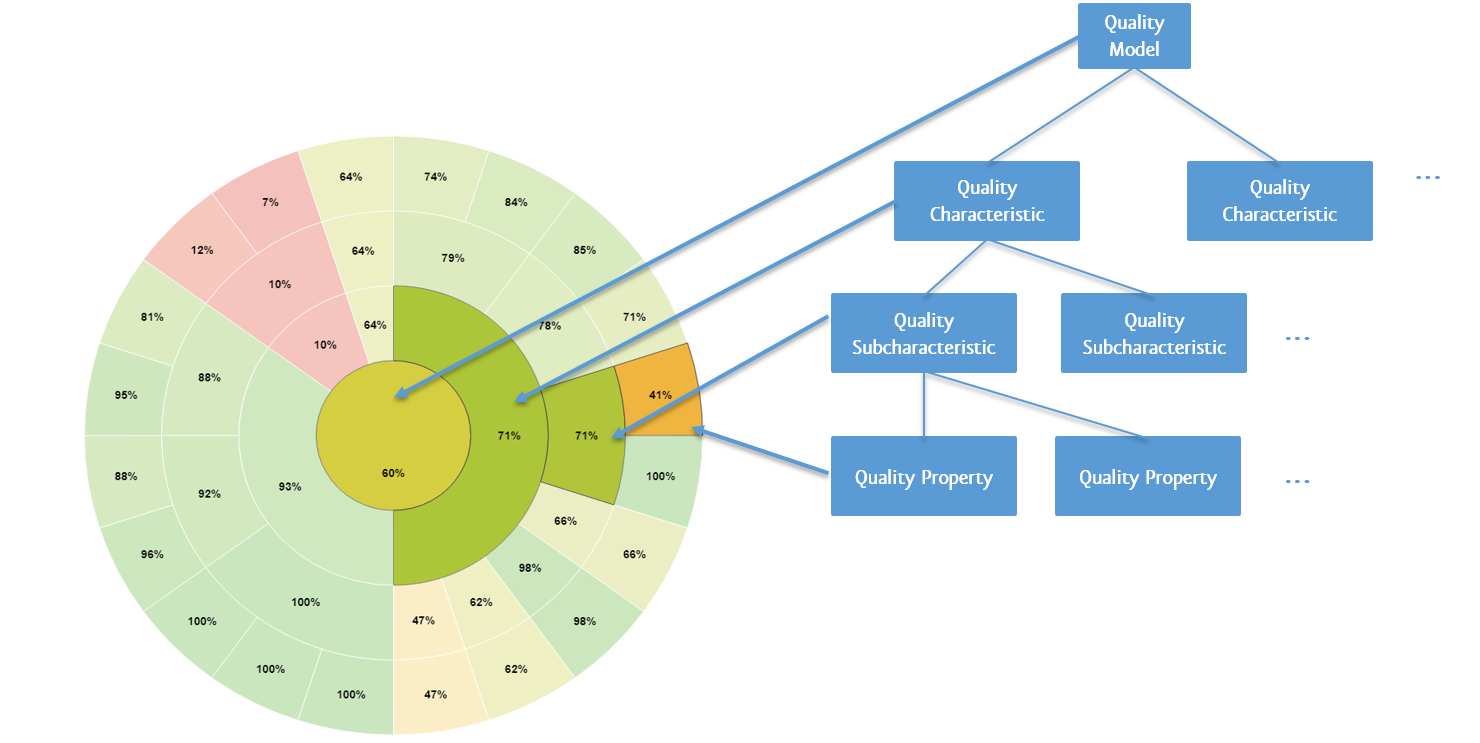
Figure 17.6 Structure of the quality model
Assume that a quality characteristic consists of only one subcharacteristic and assume further that the subcharacteristic consists of merely one quality property; the corresponding quality measure has a high impact on the overall quality measure. Now assume almost the same setting, but let the subcharacteristic now consist of 10 quality properties. In this setting, the impact of each quality property is by default only 1/10.
In order to import your quality model and your derived measures, use on Configuration panel.
17.4.2. Import project structures
Just as the the quality model the project Structures can be exported, edited and reimported easily via the configuration panel (please refer to Configuration of Project Structures for more information).