7. Configuration of Quality Model
As described in The Quality Model, MQC handles the imported data in such a way that quality can be structured and computed out of it. The configuration of the quality model including the definition of measurement functions to calculate measures for quality properties as well as the definition of base measures and derived measures have to be done in Excel. You can use the Quality Model Excel file provided by MQC as base for your configuration.
The resulting Quality Model file has to be imported (via Configuration panel ) and the contained configuration will be applied by MQC.
If you do not have a proper Quality Model file that can be adapted, you can create one with the help of MQC. From the Configuration panel, choose , which provides you an Excel file that can be used as template and where you can define your own project’s quality model.
If your imported quality model changes, you can easily reload an adapted
Quality Model file via .
Hovering over the Reload button provides a tooltip, which helps you
detecting name and filepath of the currently imported Quality Model file.
The following sections provide information on how to configure the quality model and the intended quality structures in MQC.
7.1. Base Measures and Default Values
Typically, MQC imports base measures automatically as provided by the data collecting data source. Nevertheless, the “Base Measure” sheet may be used to define all base measures that you expect to be imported from a certain data source.
As described later in Derived Measures and Quality Properties, these base measures are used to calculate other measures, so-called derived measures, and – most important – quality measures, which are the base to compute quality.
Additionally, the “Base Measure” sheet provides you the possibility to define default values. Please remember that base measures of the same type may be grouped (refer to Measures and Measurements), which results in a base measure containing multiple variable-value pairs.
In case there are values missing for variables inside such a base measure group for a certain revision, i.e. the data source has provided values for some base measure variables of a base measure group but not for all, a measurement function using these missing base measure variables could not be calculated.
As an example, please imagine the base measure group FindingCount, which
contains the variables Canceled, Aborted, Review, Failed,
Unrepaired, Warning, Info, Repaired, Passed and
Ignored. If for a certain revision the data source does not provide values
for e.g. Repaired and Passed, MQC uses the default values for the
related base measure variables as defined in the “Base Measure” sheet (see
Figure 7.1). Hence, a corresponding
measurement function can be calculated.
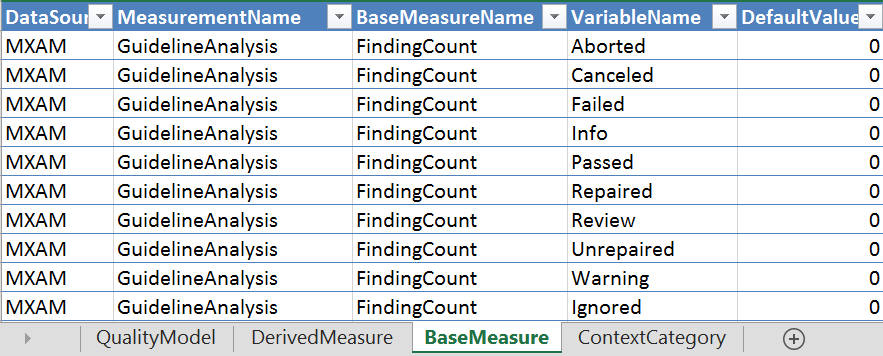
Figure 7.1 Defining default values for base measures not provided by a data source
Note
Please note, that in the Base Measure sheet of the Quality model the
previous variables have to be defined to assure if the XML report file does
not contain these values, they are substituted with the default values.
MQC uses default values only if a base measure variable inside a base measure group is missing! If the complete base measure is missing for a revision, no default values will be used!
In that case, a base measure is completely missing in the current revision but values exist for any of the previous revisions, data propagation may be used to gain a full set of available information.
7.2. Derived Measures
Derived measures are computed either from base measures or from other derived measures as explained in Derived Measures.
This may be used to shorten the definition of measurement functions, which compute quality measures for quality properties (see Quality Properties).
If you would like to configure derived measures, this can be done using the “Derived Measure” sheet of the Quality Model Excel file.
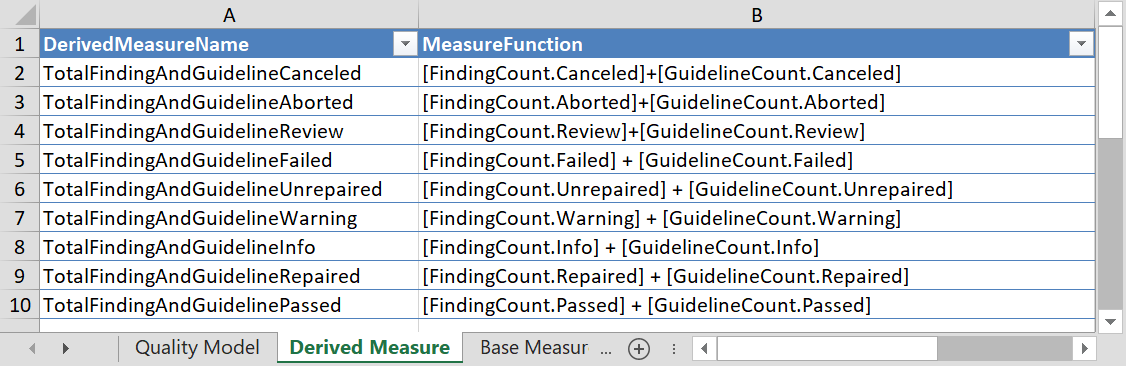
Figure 7.2 Defining derived measures using base measures provided by data sources
Figure 7.2 shows the definition of
several derived measures that are computed from various variables of the base
measures FindingCount and GuidelineCount provided by the data source MXAM. For
example, the derived measure TotalFindingAndGuidelineCanceled is calculated
by the following measure function:
TotalFindingAndGuidelineCanceled = [FindingCount.Canceled] + [GuidelineCount.Canceled]
For the explanation of the usage of the Context Categories sheet please refer to Context Categories.
7.3. Quality Properties
The “Quality Model” sheet can be used to define the lowest level of computable quality namely quality properties. For each quality property a measurement function has to be defined that is used to calculate a quality measure between 0 and 1 by using base and derived measures.
Derived measures (see Derived Measures) can be used instead of base measures to simplify quality computation, hence, to shorten the formula of a particular measurement function.
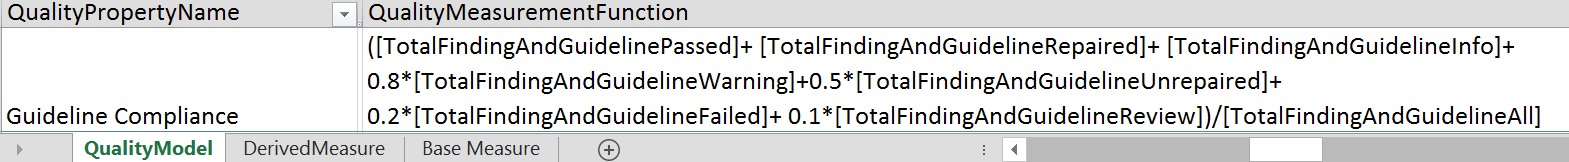
Figure 7.3 Reducing measurement functions by using derived measures defined on the “DerivedMeasure” sheet
Figure 7.3 shows an example for a
measurement function, where all base measure variables for the base measures
FindingCount and GuidelineCount were replaced by the corresponding
derived measures.
Additionally as explained in Quality Model Structure, quality in MQC is aggregated on different levels (as shown in Figure 5.4). MQC allows to assign quality properties with their measurement functions to sub-characteristics. Those sub-chracteristics again can be assigned to characteristics (see Figure 7.4). This enables the user to group quality properties in order to define different quality aspects, which may be analysed separately.
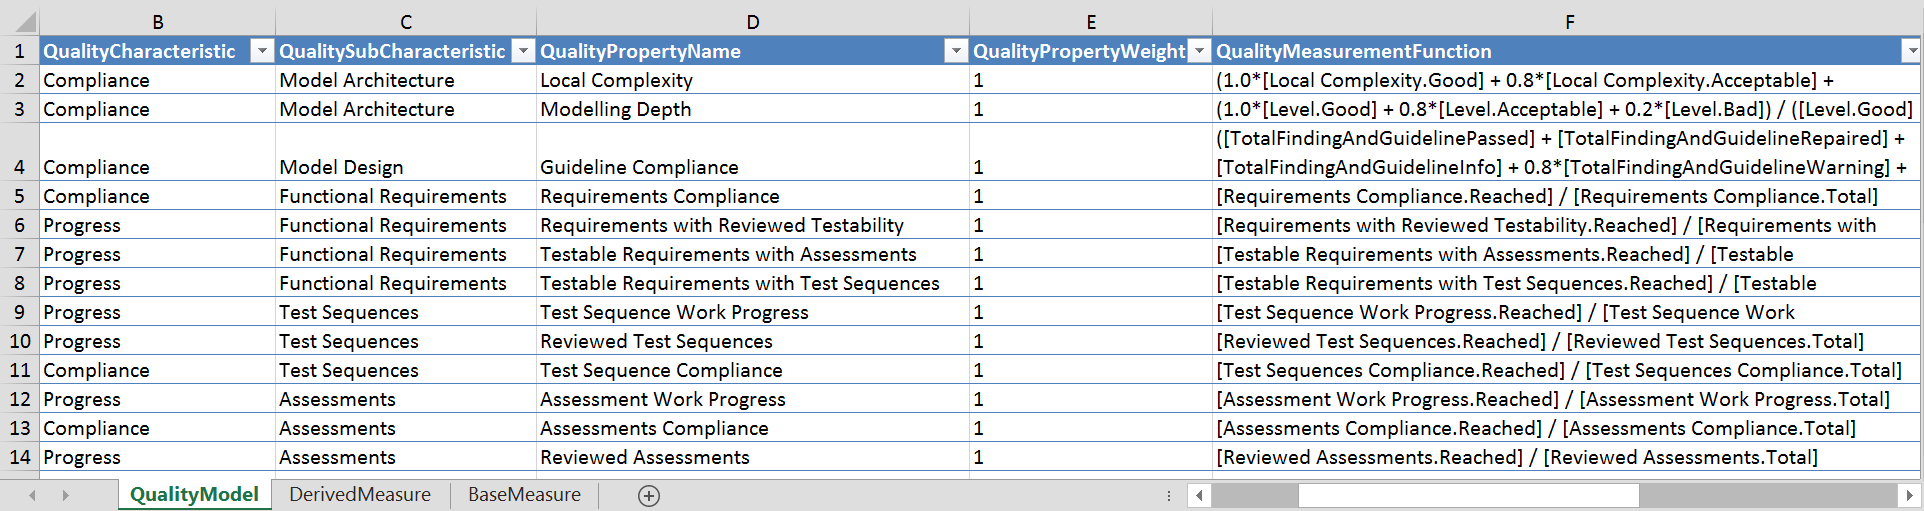
Figure 7.4 Define quality properties, measurement functions and quality model structures
The following sunburst visualization (Figure 7.5, lower right) illustrates the computation of the configured quality model.
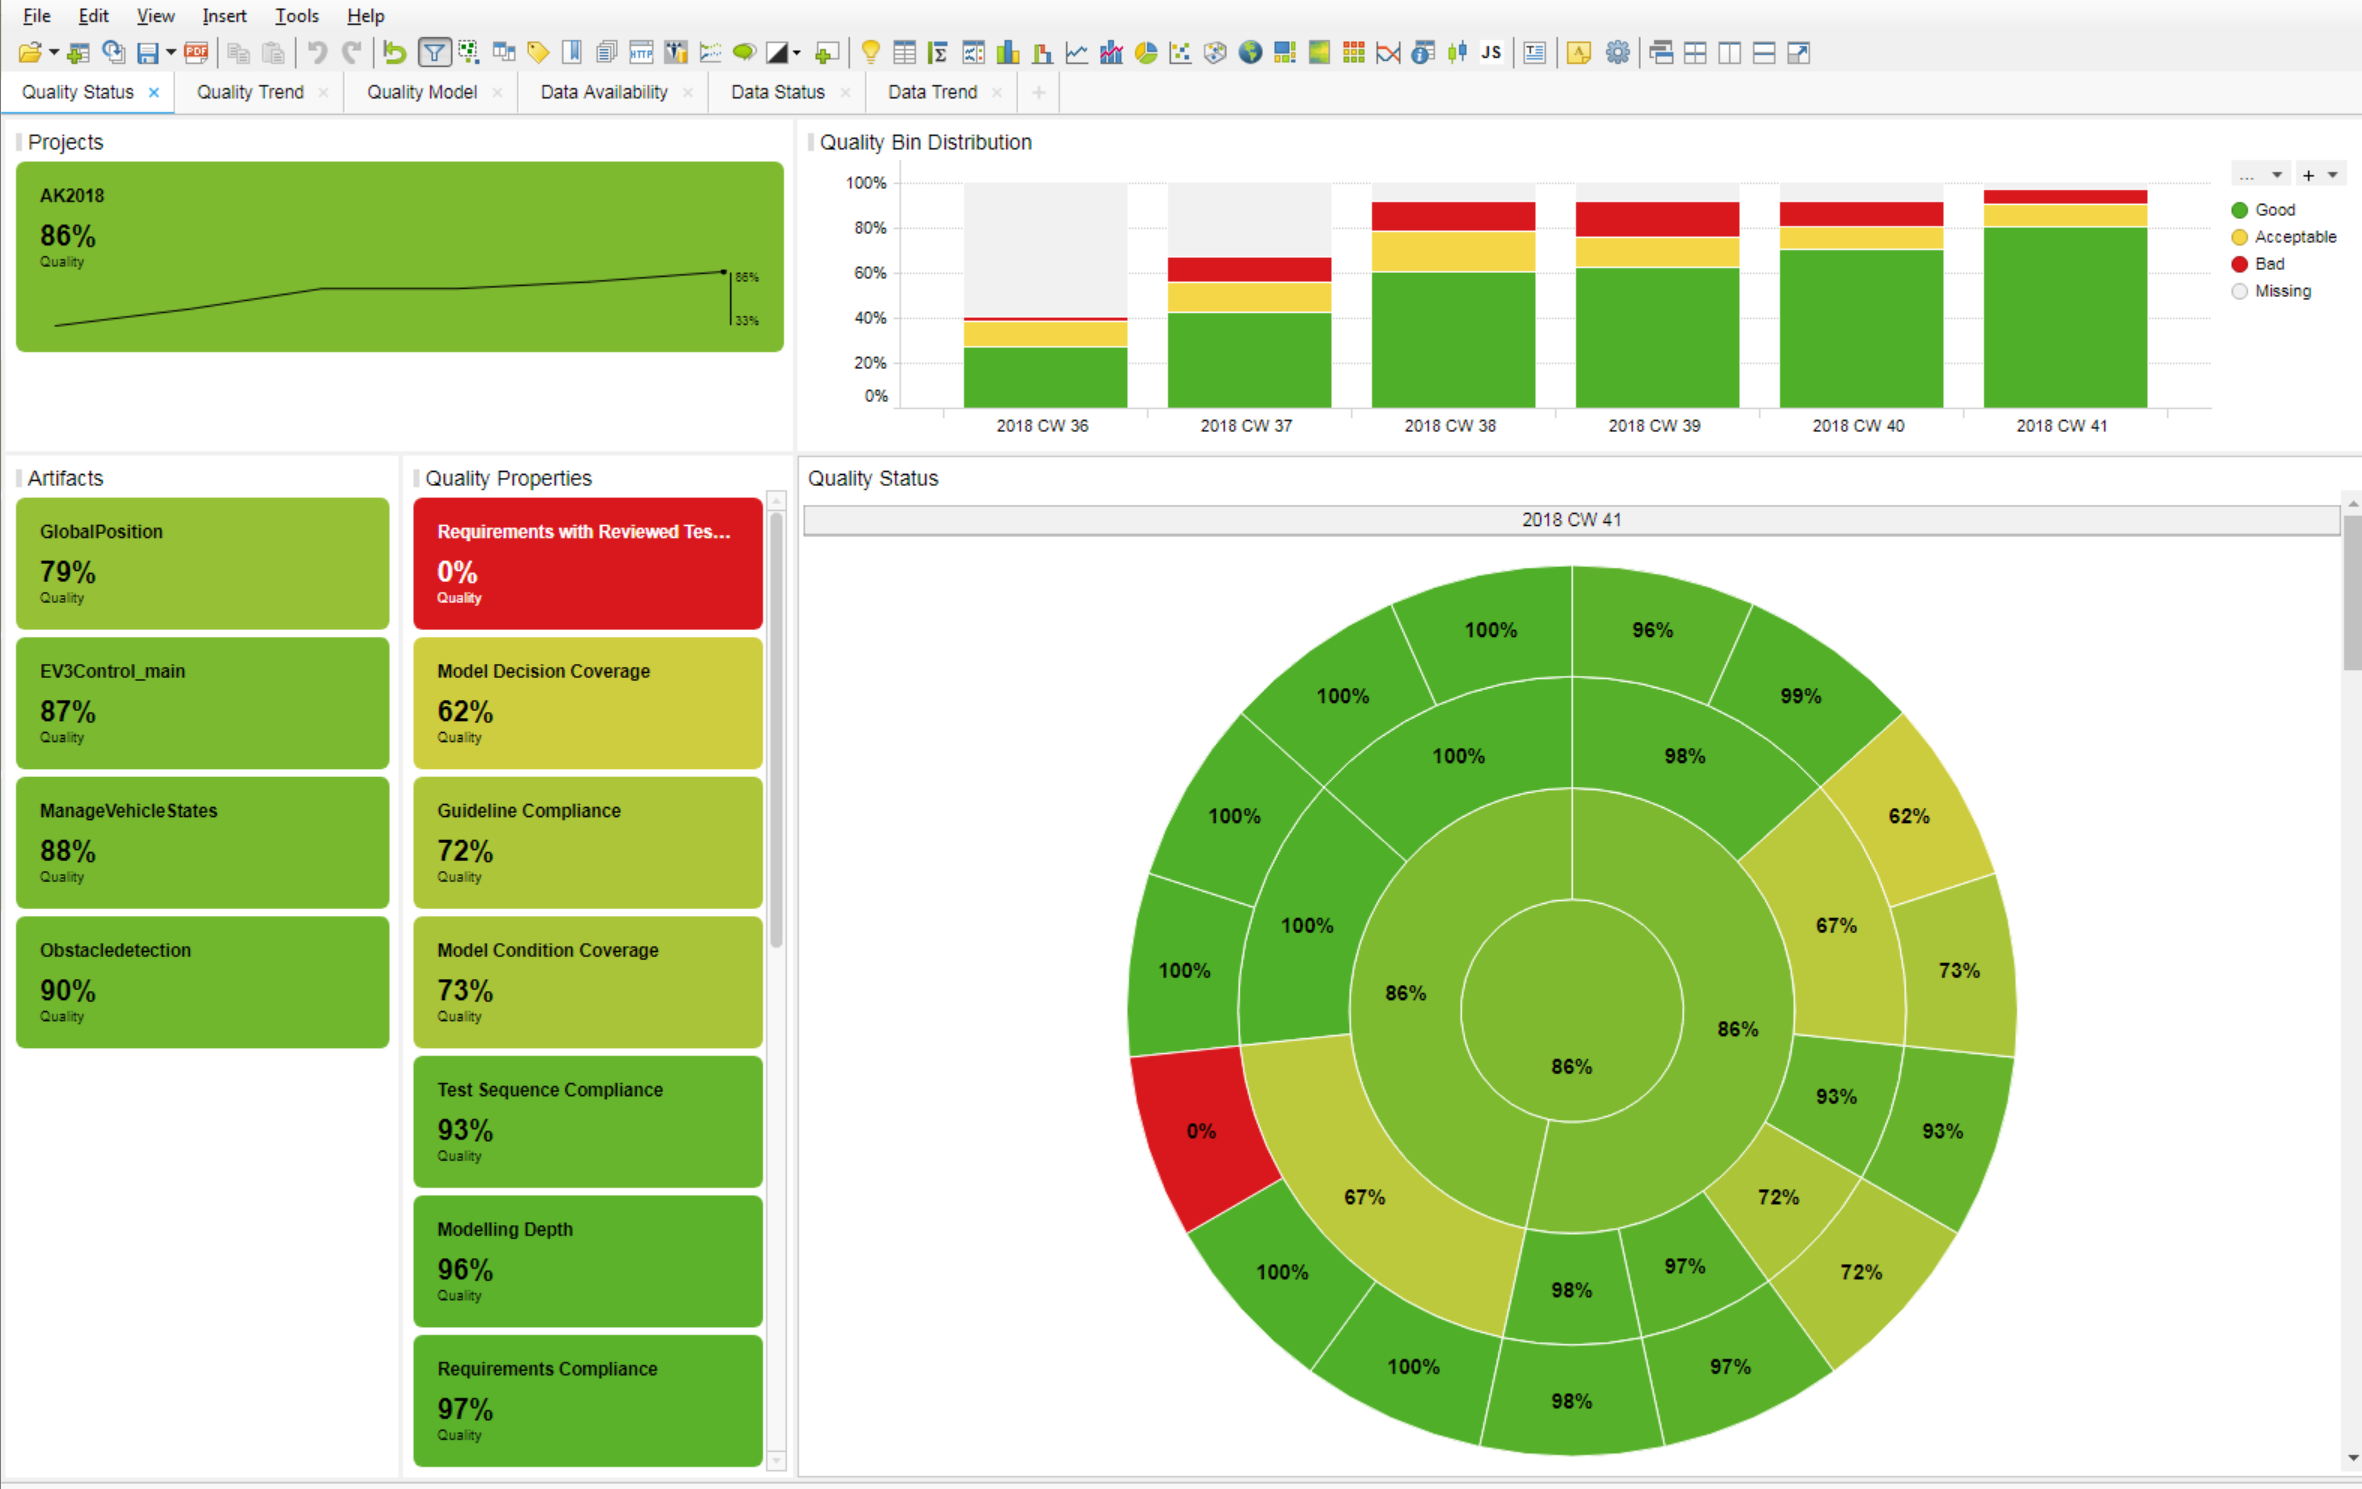
Figure 7.5 Computation of the overall quality illustrated using the sunburst visualization.
The outer ring of the sunburst consists of all quality properties defined by the quality model. Please note, each quality property is already aggregated over the artifacts (see Figure 5.6 in section Quality Aggregation).
The next ring shows the sub-characteristics defined by the quality model. A sub-characteristic is calculated using the average of all quality properties assigned to that sub-characteristic.
The third ring of the sunburst chart shows the configured characteristics. Each characteristic is calculated using the average of all quality properties assigned to all sub-characteristics belonging to that particular characteristic.
Finally, the inner circle shows the overall quality.
Note
Per default, MQC uses all quality properties to compute the separate levels of the quality model, even if the measure value for a certain quality property cannot be calculated. This may be the case if all or a few measures, which are used to compute a quality property measurement function, are not available within a certain revision, i.e. not yet measured.
Missing quality properties always are treated as 0 when calculating the overall quality of a project.
MQC allows to exclude missing quality properties for the calculation. To achive this, in the panel the check box must be enabled. This may be used to compute quality only for those parts of a project, which are already available, respectively to compute quality only based on those measures already provided.
In the example shown in Figure 7.5 all quality properties defined by the quality model are treated equally, means they have the same weight when computing the overall quality of a project. Nevertheless, MQC allows to give some quality properties a higher importance than others, which is explained in the following section (Quality Property Weights).
7.4. Quality Property Kit
When installing MQC a directory with a Quality Property kit is provided under
the following path:
C:\Users\...\AppData\Local\TIBCO\Spotfire\7.X.X\Modules\MES.MQC.CoreExtension_X.X.X.X\Resources\QualityModel\.
This zip file contains Quality Model suggestions for all Data Sources supported
by MQC. After unpacking the zip, you will find at your disposal a file structure
which allows you to easily assemble your own Quality model (including expected
base and derived measures, as well as proposed measurement functions) depending
on the data sources you are using within your project. In the following section
we will show you by the example of MES data sources how the Default Quality
Model is put together.
7.5. Quality Model for MES data sources
7.5.1. Quality Model for MXAM
In the example of section Quality Properties we have already known one possibility of defining Derived Measures and Quality Properties, including measurement function of MXAM. As Derived Measure we might also define
GuidelinesPassedCalc = [GuidelineCount.Passed]+log(1+[FindingCount.Passed],2)
By substituting the respective variable name(s) of the GuidelineCount and FindingCount measurement (in our case: Passed), we can create three further Derived Measures:
GuidelinesFailedCalc = [GuidelineCount.Failed]+log(1+[FindingCount.Failed],2)
GuidelinesInfoCalc = [GuidelineCount.Passed with Infos]+log(1+[FindingCount.Info],2)
GuidelinesWarningCalc = [GuidelineCount.Warnings]+log(1+[FindingCount.Warning],2)
Another Derived Measure might be IssueCount composed by the group of all
“bad” findings, i.e. variables of the base measure group FindingCount with
a “negative connotation”:
IssueCount = [FindingCount.Canceled] + [FindingCount.Aborted] +
[FindingCount.Review] + [FindingCount.Failed] + [FindingCount.Unrepaired] +
[FindingCount.Warning]
Similar to the previous one, the you are able to define your own Derived measures depending on the what you considered to be an issue or severe issue.
SevereIssueCount = [FindingCount.Canceled] + [FindingCount.Aborted] +
[FindingCount.Review] + [FindingCount.Failed] + [FindingCount.Unrepaired]
The last Derived Measure only differs from the previous one in not considering FindingCount.Warning a severe issue count.
The measurement function for the Quality Property of Guideline Compliance
is defined as follows:
(1.0*([GuidelinesPassedCalc] + [GuidelinesInfoCalc]) + 0.8*[GuidelinesWarningCalc] + 0.2*[GuidelinesFailedCalc]) / ([GuidelinesPassedCalc] + [GuidelinesInfoCalc] + [GuidelinesWarningCalc]+[GuidelinesFailedCalc])
7.5.2. Quality Model for M-XRAY
We can define several Quality Properties for M-XRAY.
The measurement function for Local Complexity can be defined as follows:
(1.0*[Local Complexity.Good] + 0.8*[Local Complexity.Acceptable] +
0.2*[Local Complexity.Bad]) / ([Local Complexity.Good] +
[Local Complexity.Acceptable] + [Local Complexity.Bad])
Local Complexity can be substituted by Modelling Depth,
Level, Inports, Outports or %Elementary Inputs Unused (globally).
7.5.3. Quality Model for MTest
The easiest way to define Quality Properties for MTest is by means of the most simple measurement function by dividing the Absolute or Reached values through the Reference or Total:
Requirements with Reviewed Testability =
[Requirements with Reviewed Testability.Reached] / [Requirements with Reviewed Testability.Total]
Following these pattern we can create more Quality Properties by substituting
Requirements with Reviewed Testability with
Requirements Compliance, Testable Requirements with Assessments,
Testable Requirements with Test Sequences, Test Sequence Work Progress,
Reviewed Test Sequences, Test Sequence Compliance,
Assessment Work Progress, Assessments Compliance or
Reviewed Assessments.
7.6. Measurement function definition
This section aims to give you an overview on how to define your own Quality
Properties or adapt your measurement function.
Therefore you can use a bunch of mathematical functions provided within MQC.
Apart from the four basic arithmetic operations (+, -, * and /),
MQC allows to use: Abs, Exp, Ceiling, Floor, Round, Ln,
Log, Mod, Power, Product, Sqrt, Min, Max, Avg,
WeightedAverage, Case... when and IF... else.
In the following some of these functions are explained with their possible
applications as a measurement function for a real or sample Quality Property:
We already have seen
- Log (n,2):
Given the case you only have at your disposal certain Base Measure values, for that your Quality Property calculation tends to converge to 1 using basic arithmetic operations. Here you might consider to use Log function with basis 2 (please see the Derived Measure calculation in the example above Quality Model for MXAM.)
Given the case that you want to avoid negative values in your Measurement function, you can handle this at any time of its calculation using the
Abs-function, that returns the absolute value of the argument.Abs([GuidelinesPassedCalc] - [GuidelinesInfoCalc])
or
Case... when: case when ([GuidelinesPassedCalc] - [GuidelinesInfoCalc] < 0) then 1 when ([GuidelinesPassedCalc] - [GuidelinesInfoCalc] > 0) then ([GuidelinesPassedCalc] - [GuidelinesInfoCalc]) else 0 endPowerReturns Arg1 raised to the Arg2 power. Power(Arg1, Arg2)ExpAnother useful application of mathematical functions could be the case of using theExp (argument)function, which returns e raised to the power of the argument. A linear function, such as1.0 - ([ModelClones.Clones] / [ModelClones.Subsystems])
might not be feasible to accurately adapt the Quality Property of ModelClones to your needs. Therefore, you might want to use this function:
1.0 / Exp( 2 * [ModelClones.Clones] / [ModelClones.Subsystems])
CeilingFloorRoundLnLogModPowerProductSqrtMinMaxAvgThis function calculates the average (mean) value of the input parameters: Avg(parameter 1, parameter 2, …, parameter n)WeightedAverageCase... whenIF... else
7.7. Quality Property Weights
MQC supports to define the relative importance of quality properties. In this way the weight of the process steps is mapped into the quality model. Herewith the result of the quality calculation is representing the process more realistically similar to the definition of Artifact Weights.
Following up our last example (see
Figure 7.4), where all quality properties
had the same weight of 1 (see column QualityPropertyWeight),
we now (Figure 7.6) use
different weights per quality property:
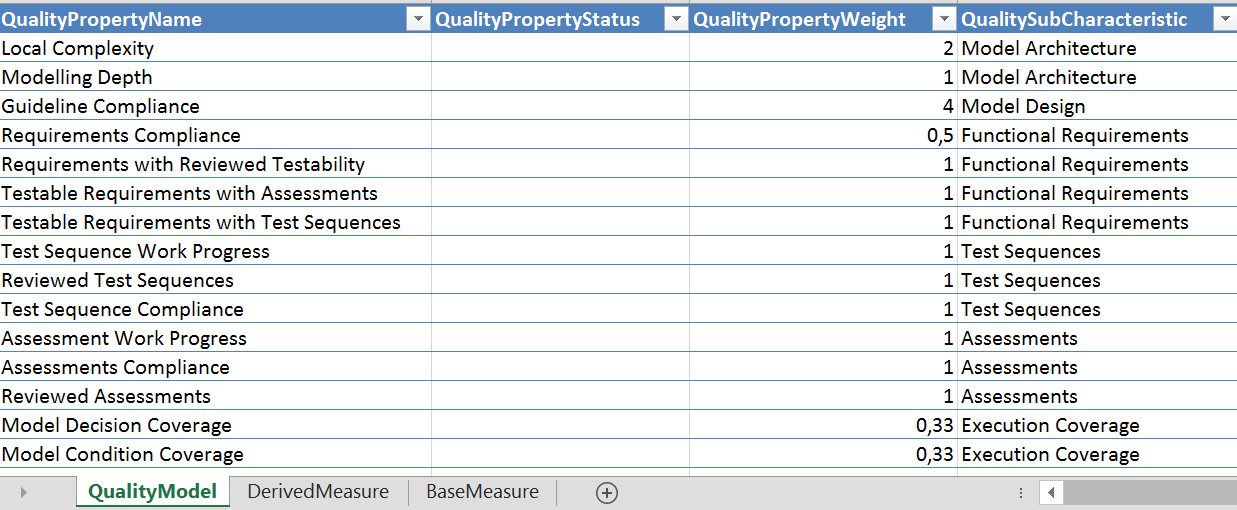
Figure 7.6 Quality property weight definition with unequal weights
After replacing the quality model (via Configuration panel ), the sunburst visualization adapts as well as the quality measures calculated for sub-characteristics, characteristics and the overall quality of the project.
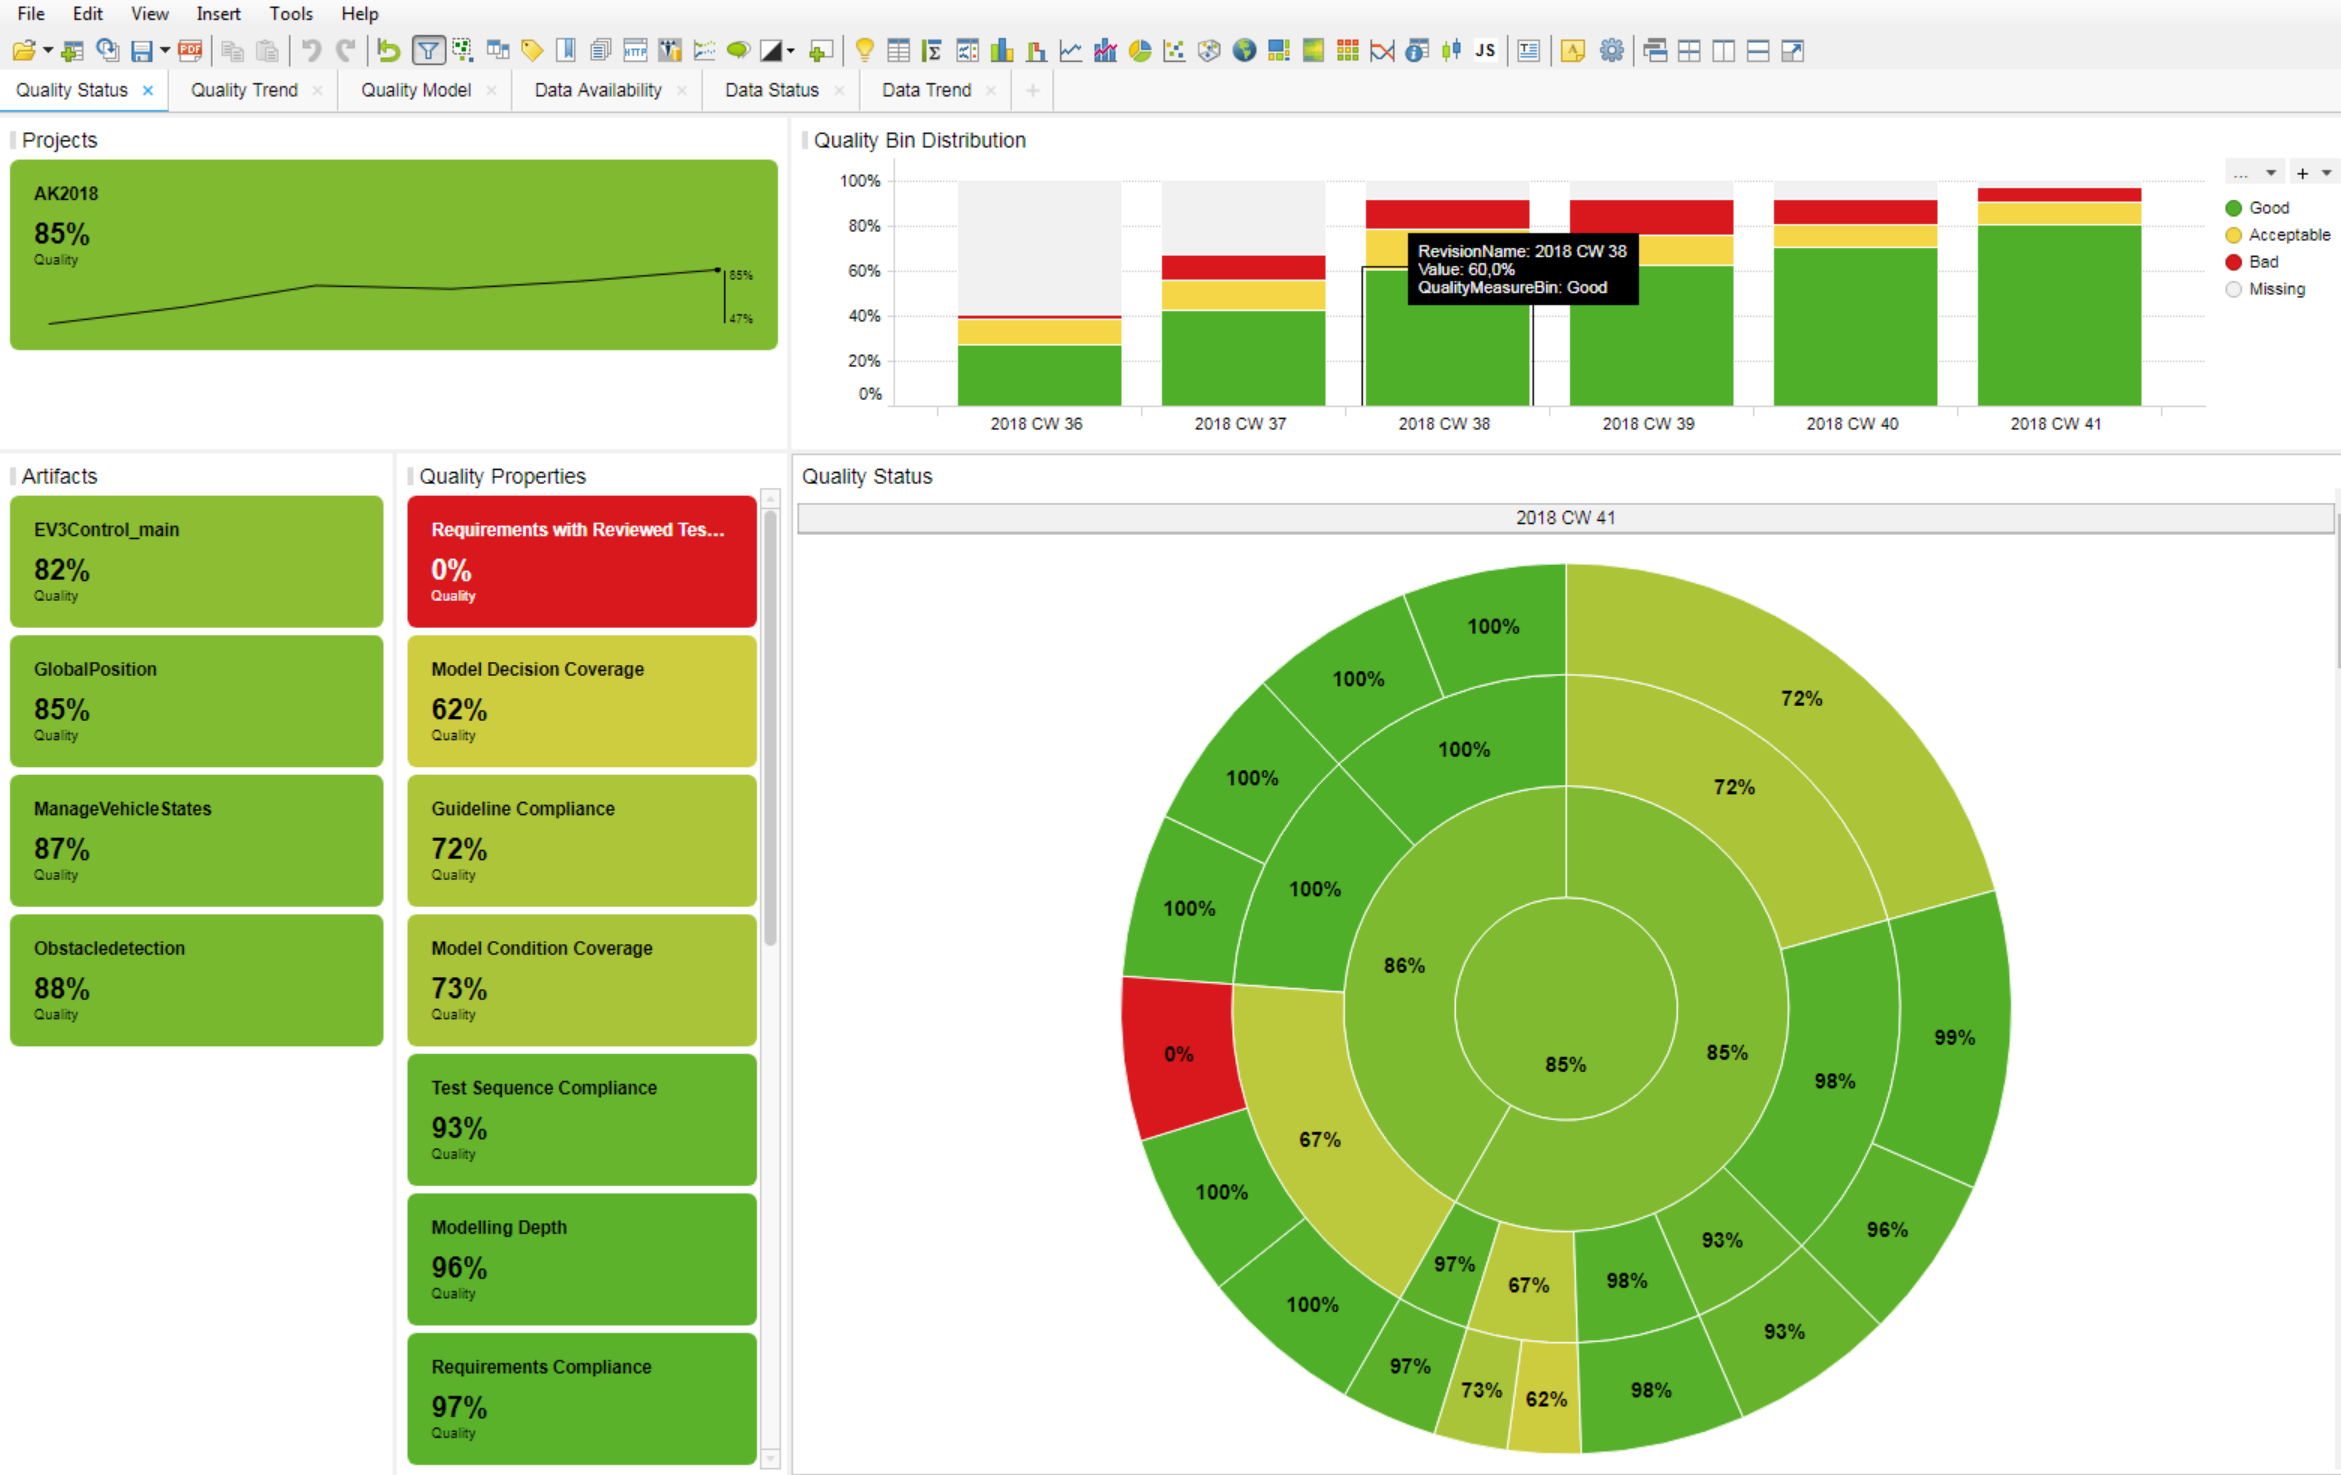
Figure 7.7 All quality properties now have a size according to their configured weights and are included with unequal proportions in the computation of the overall quality.
The size of each quality property tile (outer ring of the sunburst visualization) adjusts according to the weight of the quality property configured in the quality model.
Each level of the quality model now uses the weighted average for quality computation.
Finally, Figure 7.7 shows a different overall quality (inner circle of the sunburst chart) compared to the example without weights as shown in Figure 7.5.