13. Data Sources supported by MQC
This chapter gives you an overview about what Data Sources MQC supports by means of its adapters. Therefore, the user is able to keep track on those measures that are imported into MQC and can be used for the definition of the Quality Model.
The current release of MQC supports the following tools: MES Model Examiner® (MXAM), MES M-XRAY® (MXRAY) and MES Test Manager® (MTest), as well as PikeTec TPT, Razorcat Tessy, MathWorks Polyspace and BTC EmbeddedTester.
For the case there is no adapter, MQC puts at the user’s disposal the possibility of a manual import of Base Measures (see Manual data import).
13.1. MES Model Examiner® (MXAM)
13.1.1. MXAM Data imported by MQC
MQC supports the standard MXAM report file (.mxmr).
The following example of an MXMR report describes which information is imported by MQC’s MXAM adapter to MQC:
from the
<RReport>element, specifically thedateelement:ReportDateTime
from the
<artifacts>element, the<properties key="modelname">element:ArtifactName
MXAM provides guideline and finding result data for each artifact in the MXMR Report. Therefore, each artifact section will be parsed to get the information of the artifact result, model type and all findings and guideline results.
  <artifacts result="Review" adapterId="com.modelengineers.mxam.tooladapter.matlab" storageNature="Tool artifact">
  <properties key="modelname" value="ReportReviewSldemo_wheelspeed_absbrake" visible="true"/>
  <properties key="modeltype" value="MOD" visible="true"/>
  <properties key="dynamic" value="" visible="true"/>
  …
  <summary itemType="Findings">
    <statistic resultType="Review" count="3"/>
    <statistic resultType="Failed" count="66"/>
    <statistic resultType="Info" count="28"/>
    <statistic resultType="Passed" count="12"/>
    <statistic resultType="Ignored" count="2"/>
  </summary>
  …
  <summaries itemType="Guidelines">
    <statistic resultType="Review" count="1"/>
    <statistic resultType="Failed" count="5"/>
    <statistic resultType="Passed with Infos" count="24"/>
    <statistic resultType="Passed" count="11"/>
  </summaries>
</artifacts>
The adapter reads those measures to be found in the Findings and Guidelines
header: <Summary itemType="Findings"> and
<Summary itemType="Guidelines">. Please, note that a MXAM report can
contain various artifacts and for each artifact MQC reads out the Findings and
Guidelines Summary, that are saved as FindingCount and GuidelineCount,
respectively:
ReviewFailedInfo(for FindingCount) andPassed with Infos(for GuidelineCount)PassedIgnoredAbortedCanceledRepairedUnrepairedWarning(for FindingCount) andWarnings(for GuidelineCount)
To get more insight of how these Base Measures are processed to a measurement function, please refer to Quality Model for MXAM.
13.1.2. MXAM Tool Page
Besides the standard data and quality pages, MQC provides an additional tool page showing details on data provided by MXAM.
From the menu bar choose to add the MXAM tool page.
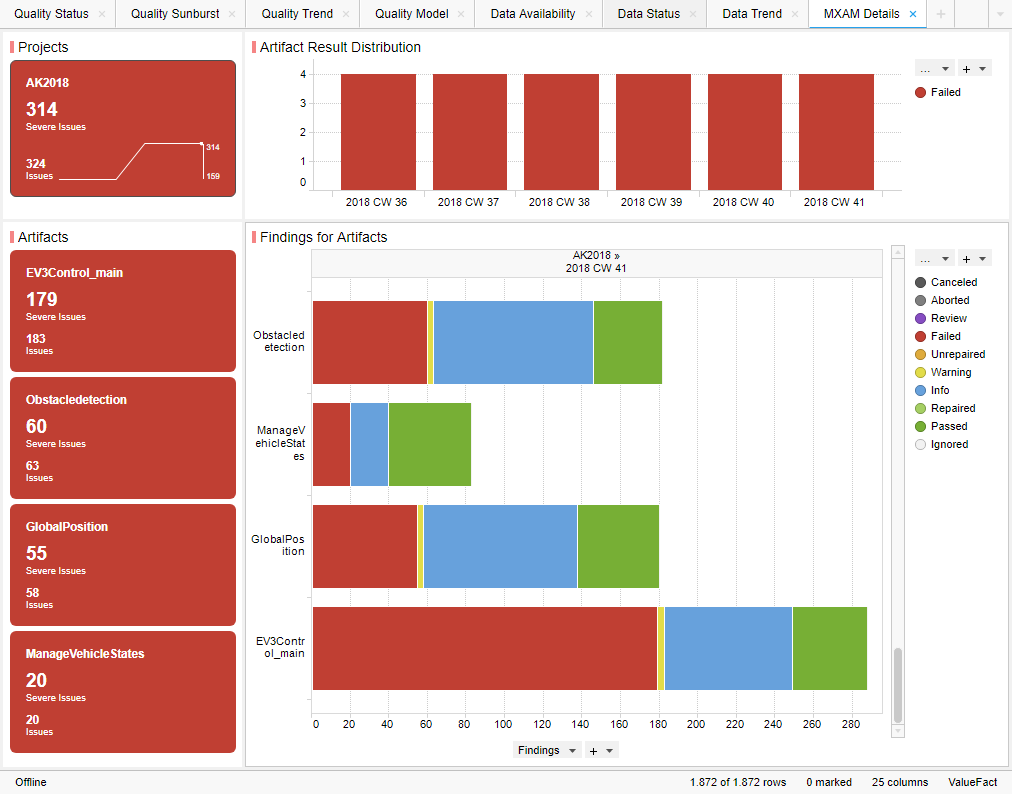
Figure 13.1 MXAM Details Page showing Findings per Artifact and Revision
The main visualization (horizontal bar chart) shows for each artifact all
findings based on FindingCount (e.g. Failed, Passed, Warning etc.
as provided by the MXAM report). As long as data for multiple revisions is
imported and no particular revision is marked respectively, the visualization
offers to scroll between revisions to get the finding status for a certain
point in time.
The Artifact KPI on the left-hand side shows a tile for each artifact colored
according to the worst finding result for this artifact (using the MXAM results
order), i.e. in Figure 13.1 all artifacts have failed checks,
but no findings for Canceled, Aborted or Review. So, all tiles are
colored red.
The MXAM result coloring is shown in the following figure:
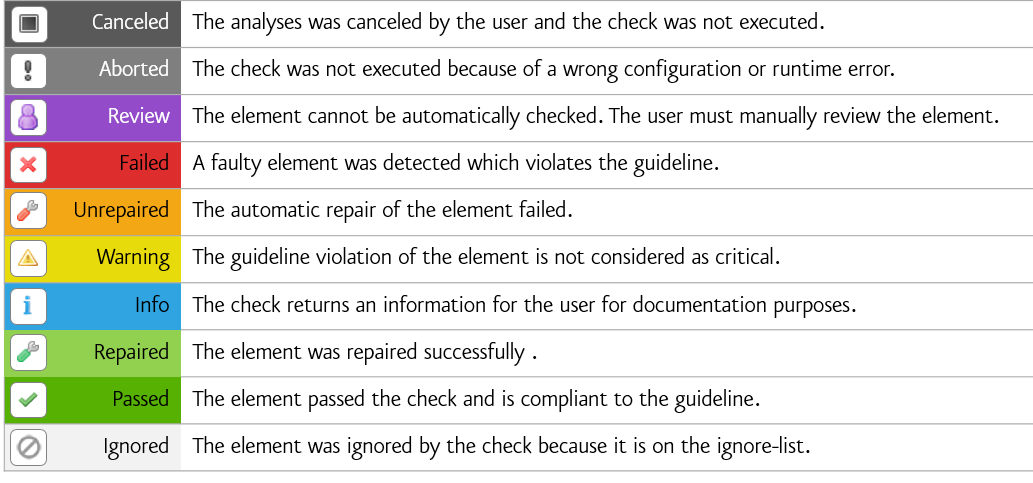
Figure 13.2 List of all existing MXAM results
Additionally each tile shows per artifact:
the number of severe issues (sum of
Aborted,Canceled,Failed,ReviewandUnrepairedfindings)the number of issues (servere issues plus
Warning)
The Project KPI chart on the top-left of the page shows the color of the worst finding over all artifacts as well as the number of severe issues and issues summed up over all artifacts.
The distribution chart (top-right) shows for each revision the number of
artifacts binned according to their worst findings. For the example in
Figure 13.1 this means there are four artifacts in total, all
of them with Failed findings.
By these means the user gets an overview on
how many findings per artifact exist
which findings per artifact exist
what are the worst findings to concentrate on first (for each artifact and for the whole project)
and how this has evolved over time (e.g. from project start time until actual date).
13.2. MES M-XRAY® (MXRAY)
13.2.1. MXRAY Data imported by MQC
MQC supports the Standard XML MXRAY Report file.
The following information is extracted by the MQC/ MXRAY adapter:
from the
<Timestamp>elementReportDateTime
from the
<SubsystemQualityOverview>header all included elements, usually these are:Local ComplexityLevel%Elementary Inputs Unused (globally)Cyclomatic ComplexityInportsOutports
For each of these Measures the variables
Good,AcceptableandBadare imported. Furthermore forLocal Complexitythe variablesLowerBoundOfAcceptableandLowerBoundOfBadare read .from the
GlobalValueSummaryelementGlobal Complexity (Ref0)Global Complexity (Ref1)Global Complexity (RefN)
from the
CloneGroupselementNumberOfDetectedCloneGroupsNumberOfSubsystemsAnalyzedNumberOfUniqueSubsystemsInAllCloneGroupsNumberOfSubsystemsInAllCloneGroups
Note
In MQC CloneGroups.NumberOfUniqueSubsystemsInAllCloneGroups is shown
as CloneGroups.Bad:
Bad = NumberOfUniqueSubsystemsInAllCloneGroups
Additionally CloneGroups.NumberOfSubsystemsAnalyzed is used together
with CloneGroups.NumberOfUniqueSubsystemsInAllCloneGroups to calculate
a value for CloneGroups.Good:
Good = NumberOfSubsystemsAnalyzed - NumberOfUniqueSubsystemsInAllCloneGroups
To get more insight of how these Base Measures are processed to a measurement function, please refer to Quality Model for M-XRAY.
13.2.2. MXRAY Tool Page
Besides the standard data and quality pages, MQC provides an additional tool page showing details on data provided by MXRAY.
From the menu bar choose to add the MXRAY tool page.
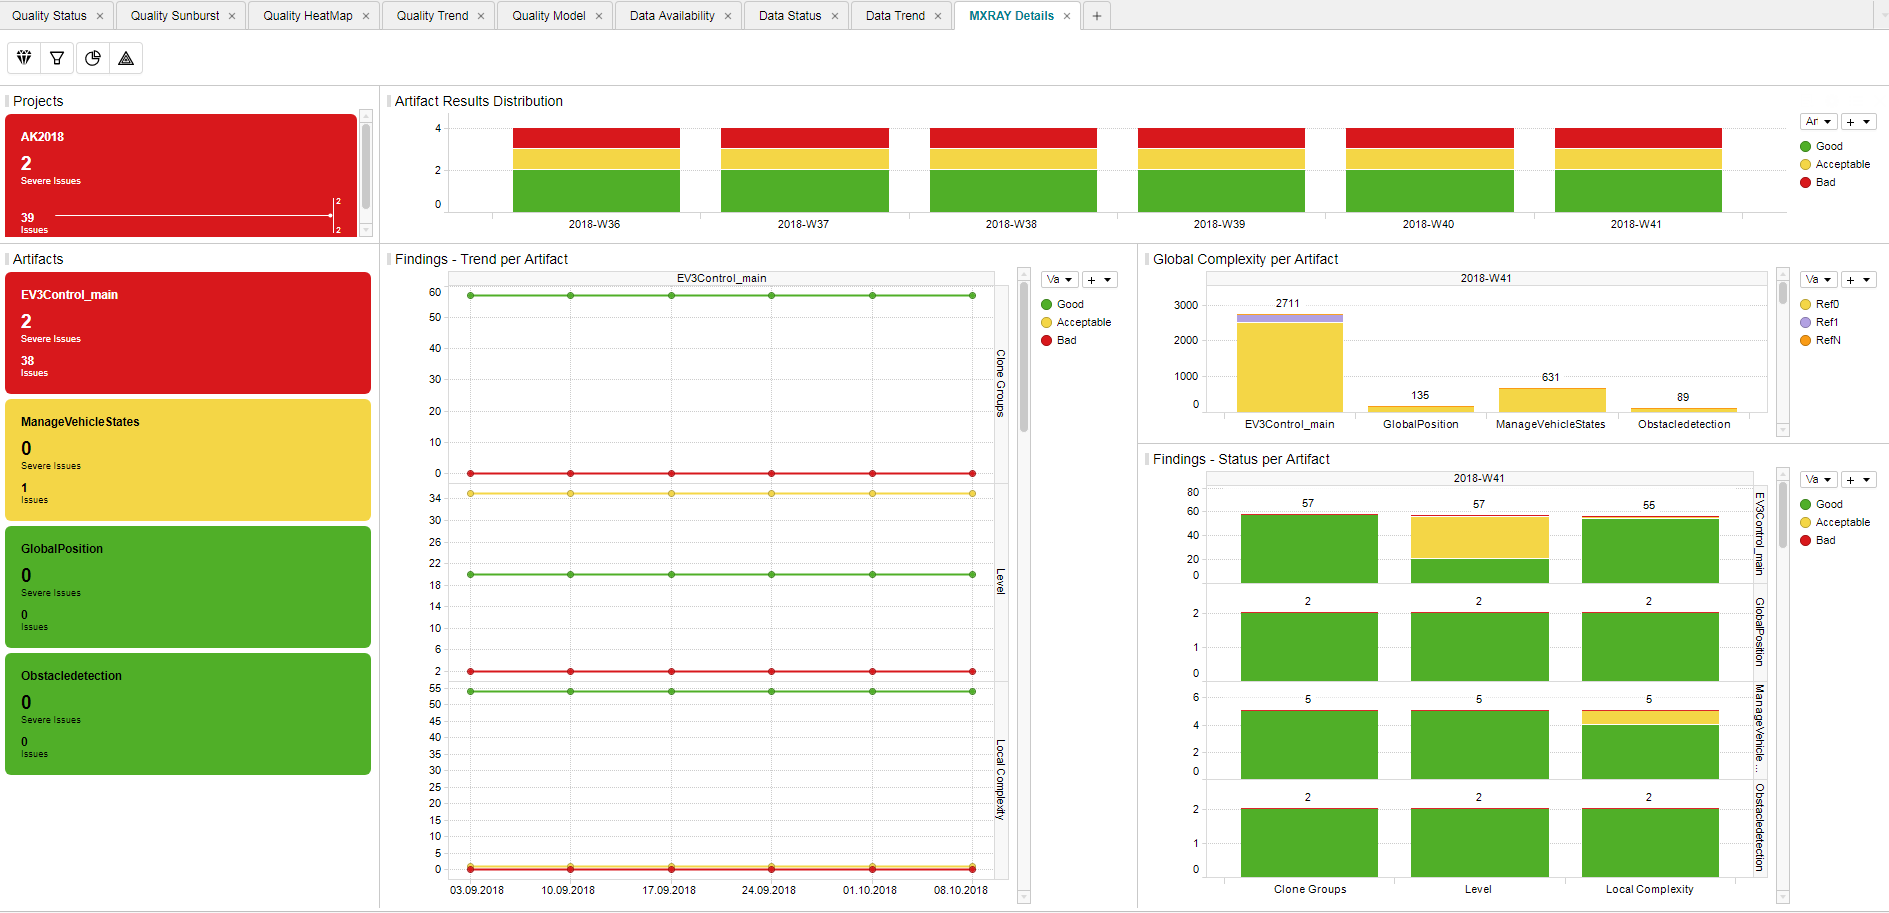
Figure 13.3 MXRAY Details Page showing Findings in Trend and Status and Global Complexity per Artifact and Revision
This page contains three main visualizations:
Global Complexity per Artifact
Status of subsystem results per base measure and Artifact
Trend of subsystem results per base measure and Artifact
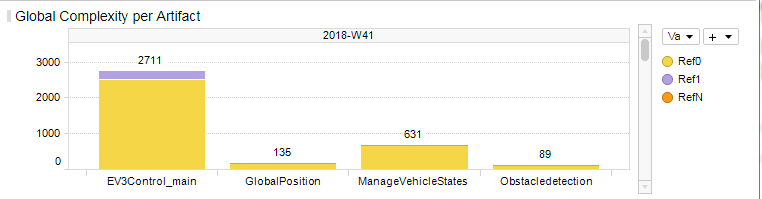
Figure 13.4 MXRAY Global Complexity per Artifact
The Global Complexity visualization (Figure 13.4) shows for each artifact the stacked values of Ref0, Ref1 and RefN, where:
Ref0 is the global complexity of the model itself excluding all referenced libraries resp. models
Ref1 includes the global complexity of referenced libraries/models exactly one time (each library/model is counted once)
RefN includes the global complexity of referenced libraries/models whereas a complexity value is added for each occurence (each library/model may count multiple times depending on how often a library/model is referenced)
The global complexity visualization shows the values for Ref1 and RefN just in addition to Ref0, which means
Ref1 (as shown) = Ref1 (as measured) - Ref0
RefN (as shown) = RefN (as measured) - Ref1
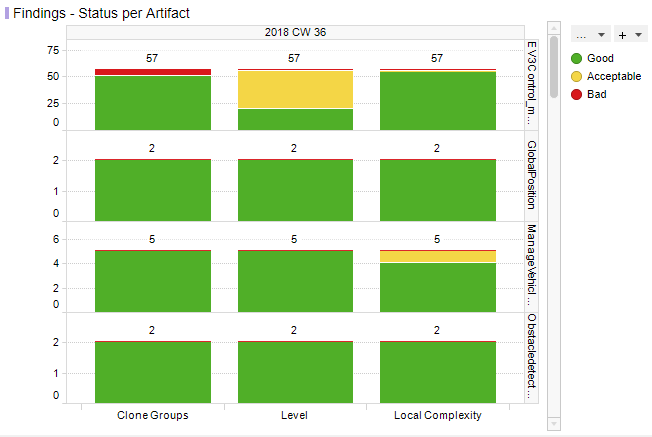
Figure 13.5 MXRAY Subsystems Results Status per Base Measure per Artifact
Figure 13.5 shows reported results per base measure per artifact. The user gets an overview on how many subsystems per artifact are stated good, acceptable or bad for all metrics provided by the imported report:
Local ComplexityLevelCloneGroups(GoodandBadonly, see adaptation of clone group values as previously described)
Note
As long as data for multiple revisions is imported and no particular revision is marked respectively, all status visualizations (bar charts) offer the option to scroll between revisions.
The third main visualization showing the trend of subsystem results (see Figure 13.6) shows the same metrics as listed above, but rather its evolution over time than the status for a certain revision.
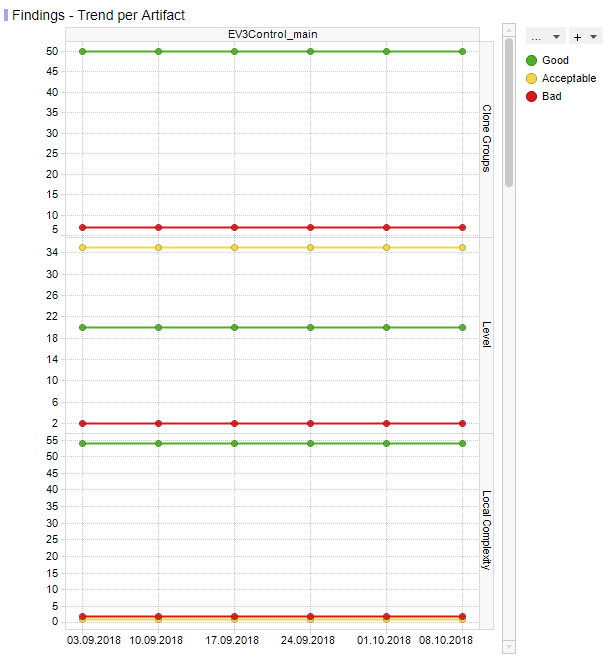
Figure 13.6 MXRAY subsystem results Trend per Base Measure per Artifact
With that the user is able to see the number of good subsystems that increase during the project runtime while the number of acceptable and bad subsystems decreases. It is also possible to detect an increase of the overall number of subsystems per model at a certain point in time (e.g. if a model was extended during development).
If there are multiple selected artifacts (or no specific one), the user is able to scroll between artifacts to see the trend figures for a particular artifact.
The Artifact KPI on the left-hand side shows a tile for each artifact colored according to the number of found severe issues or issues, respectively.
Severe Issues:
Sum of all
Badmeasures per artifact.Issues:
Sum of all
BadANDAcceptablemeasures per artifact.
If there is any Severe Issue, which means a base measure (e.g. Level or
Local Complexity) with a variable value of Bad > 0, the artifact tile
is colored red.
If there are no Severe Issues, but Issues (which means a base measure
with a variable value of Acceptable > 0) are found, the artifact tile is
colored yellow.
All other artifact KPIs are colored green.
The Project KPI chart on the top-left of the page shows the color of the worst result over all artifacts as well as the overall number of Severe Issues and Issues for the whole project.
The distribution chart (top-right) shows for each revision the number of artifacts binned according to their worst result.
By these means the user gets an overview on
the global complexity of each artifact compared to all other artifacts
how many issues (e.g. subsystems with problems) per artifact exist
which issues per artifact exist (e.g. subsystems with bad local complexity)
what are the worst issues to concentrate on first (for each artifact and for the whole project)
and how this has evolved over time (e.g. from project start time until actual date).
13.3. MES Test Manager® (MTest)
13.3.1. MTest Data imported by MQC
The MQC-MTest adapter supports the MQC-XML format for MTest Report files.
The MTest XML report consists of one <DataEntryList> header, which contains
several <DataEntry> elements, each of them containing all the information
for one Base Measure and Artifact.
The following information is extracted by the MQC/MTest adapter:
from the
<RevisionDate>elementReportDateTime
from the
<ArtifactNameOrAlias>elementArtifactName
from the
<DataSourceNameOrAlias>element theBaseMeasureNamewith its two variables (read out of the<DataSourceValue>element):Absolutestored in MQC asReachedReferencestored in MQC asTotal
According to this pattern, from the <DataEntryList> element, the following
Base Measures are imported with its respective variables (Reached and Total):
Assessment Work ProgressModel Condition CoverageModel Decision CoverageRequirements ComplianceRequirements with Reviewed TestabilityReviewed AssessmentsReviewed Test SequencesTest Sequence Work ProgressTest Sequences ComplianceTestable Requirements with AssessmentsTestable Requirements with Test SequencesTestable Requirements
For the following Base Measures only exists one value that is stored in the
variable Reached:
Total AssessmentsTotal RequirementsTotal Test Sequences
To get more insight of how these Base Measures are processed to a measurement function, please refer to Quality Model for MTest.
13.3.2. MTest Tool Page
To dig more into details from the Base Measures and Quality properties of the MTest tool, MQC provides an additional MTest Details page.
From the menu bar choose to add the MTest tool page.
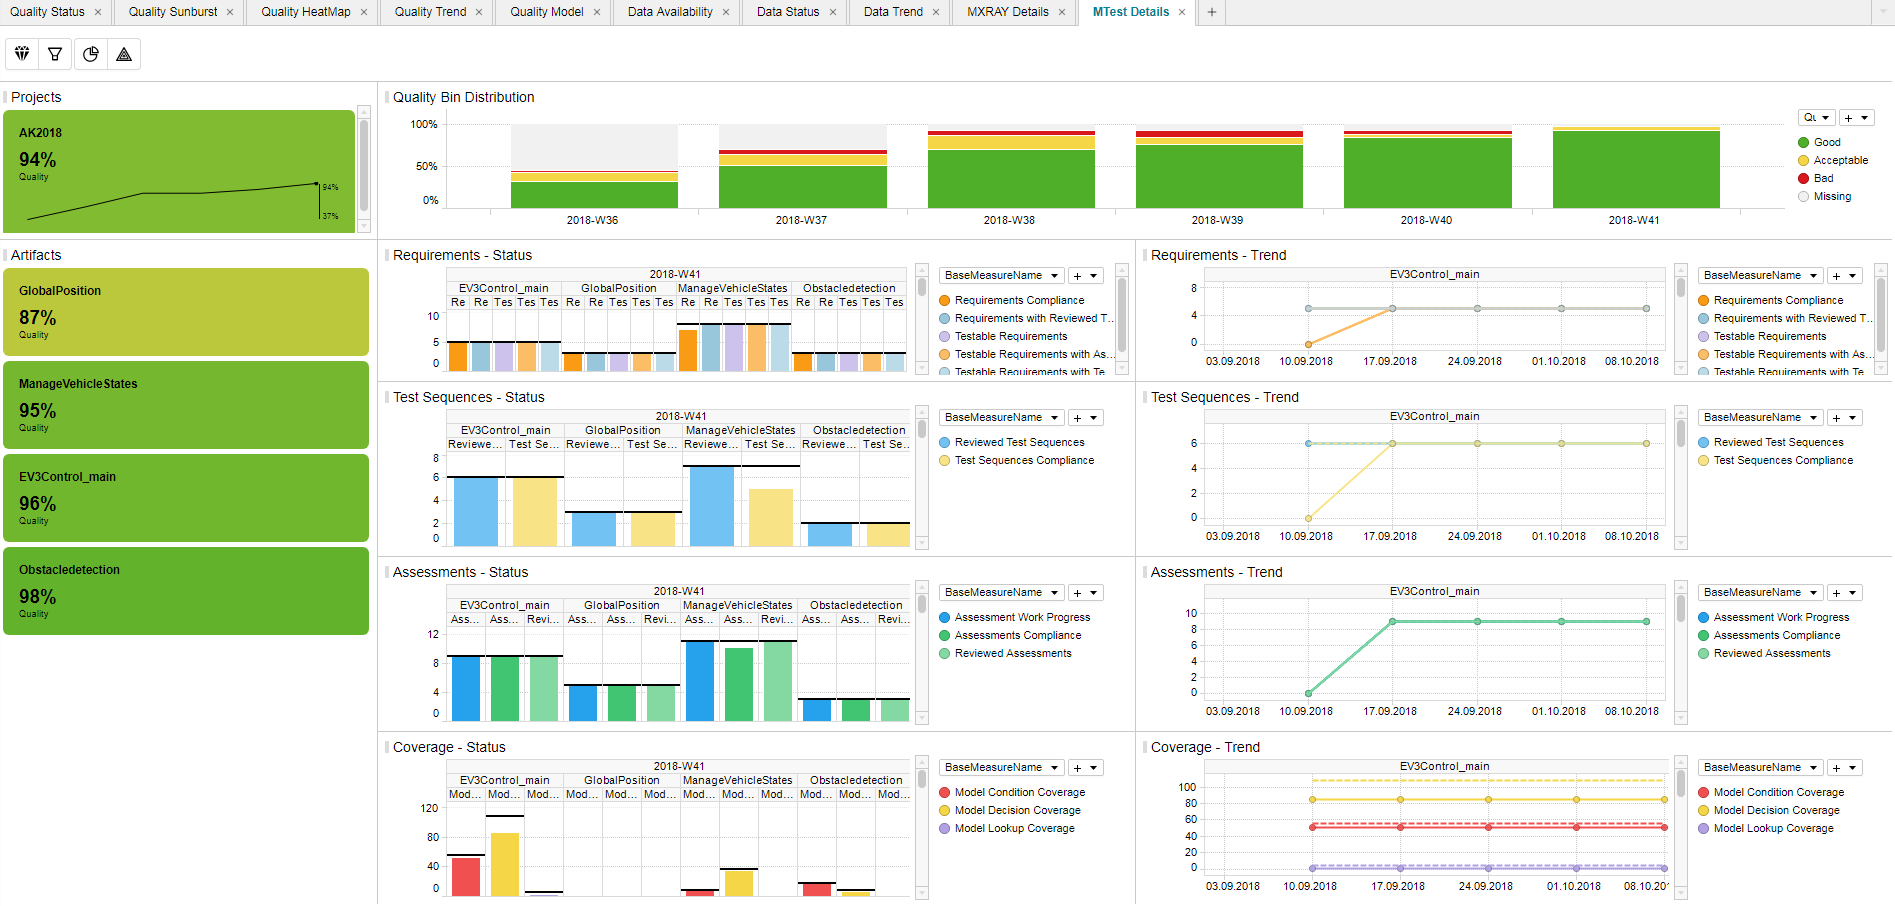
Figure 13.7 MTest Details Page showing Trend and Status
The visualized data is structured by
Requirements
Test Sequences
Assessments and
(Structural) Coverage.
For each Base Measure MTest provides two values, read and visualized by MQC:
Total, e.g. the total number of reviewed Test Sequences, andReached, e.g. the actual number of reviewed Test Sequences
Both values are shown in Status (see Figure 13.8) as well as in Trend (see Figure 13.9).
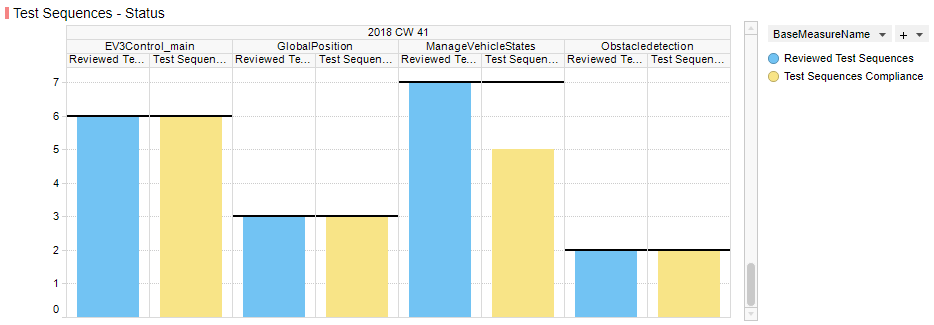
Figure 13.8 Measure Status visualization for Test Sequences
Each status diagram shows the Reached values of the imported base measures
as bar charts per artifact. The Total values are shown as horizontal line
(i.e. like a target to be reached) for each measure bar.
As long as data for multiple revisions is imported and no particular revision is selected respectively, MQC offers to scroll between revisions. The Artifact KPI selector (on the left-hand side) is used to limit the shown data for particular artifacts.
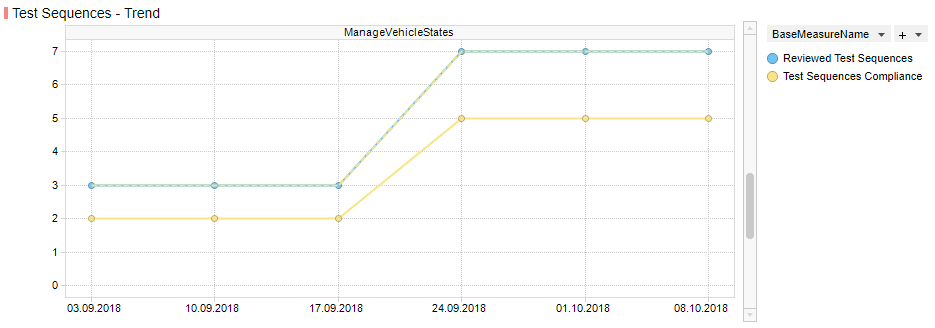
Figure 13.9 Measure Trend visualization for Test Sequences
Each trend diagram shows the Reached values of the imported base measures
as a trend line over revisions per artifact. The Total values are shown as
an additional dotted line (i.e. like a target to be reached) for each shown
measure trend.
If multiple artifacts (or no specific artifact) are (is) selected, the user is able to scroll between artifacts to see the trend figures for a particular artifact.
Artifact KPI selector (left-hand side), Project KPI selector (top-left) and Bin Distribution chart (top-right) are showing quality as on the MQC quality pages.
By these means the user gets an overview on
the progress of the functional tests
the current status of the functional tests
certain Artifact(s)
a certain test area.
13.4. Manual data import
MQC provides the possibility to import data from any other data source using the manual import option.
The manual import has to be done in Excel. You can use this Excel template to
create data that should be loaded to MQC. A template to import manual
data in MQC, called ManualDataImport_Template.xlsx is provided within:
C:\Users\...\AppData\Local\TIBCO\Spotfire\7.X.X\Modules\MES.MQC.CoreExtension_X.X.X.X\Resources\SampleFiles\.

Figure 13.10 Sample file for manual import of two Base Measures for two Artifacts for the same revision
The column Artifact consists of entries representing the objects for which
data shall be collected and for which quality shall be computed (e.g. Simulink
models, requirements documents, software components).
The entries of the column ReportDateTime are considered by MQC as the days
of raising the data, which shall be collected.
Using the syntax DataSource . Measurement . Measure . Variable,
you are able to load into your project any data you want. Use DataSource to
specify where your data is coming from (e.g. the name of the tool which
produced the data). You can optionally fill out Measurement to provide more
structuring regarding the data (e.g. the reason why data is collected, the test
environment or contexts models have been through, etc). Use the
Measure to provide more structuring of your data regarding the result of
the measurement. To do that, give a name (the entry of the Measure field) and
a Variable. Finally, the Value contains the metric value that you would
like to import for the artifact and the related revision. It is recommended to
fill out Measurement to achieve a high compliance to ISO 250xx and to avoid
that a default name is provided by MQC, which has probably no meaning to you.
As shown in Figure 13.10 you should put your variables using
DataSource . Measurement . Measure . Variable syntax within
the excel column name. The value for the respective Artifact for a
ReportDateTime has to be assigned to the corresponding line.
In case you might want to assign default values for your imported Base Measures, you have to define them in compliance with this syntax within the Quality Model Base Measure excel sheet (see Figure 7.1).
13.5. PikeTec TPT
TPT is considered an (xml-based) external test tool for which an MQC adapter executes the following operations presented by the example of the following extract of an TPT example XML report:
<Header ExecutionConfig="Lights Control MATLAB" ExecutionDate="14:47:58 10.05.2016" TptFileName="D:\requirements.tpt" TptVersion="8u2">
  <Property Name="Model Under Test" Value="D:\matlab-platform\lights_control_simulink.mdl"/>
  <Property Name="System Under Test" Value="lights_control_simulink/lights_control"/>
  <Platform History="100" Name="MATLAB-Platform" Stepsize="10000" Timeout="60000000">
    <Property Name="MATLAB Version" Value="MATLAB 8.4"/>
  </Platform>
</Header>
…
<Summary AssessmentDuration="2.518" ExecutionDuration="2.078">
  <ExecutionSummary Errors="0" Failed="6" Inconclusive="0" Succeeded="5" Tests="11"/>
</Summary>
MQC reads out
from the main
<Header.. >ExecutionDateTime(stored in MQC asReportDateTime)SystemUnderTest Value(stored in MQC asArtifactName), in this case “lights_control_simulink/lights_control”. Please, note that TPT stores in the XML only the name (instead of the complete path) of the subsystemTptVersionPlatFormName
from the
<ExecutionSummary>header the categoriesTests(stored in MQC asTestCount.Test)Succeeded(stored in MQC asTestCount.Succeeded)Failed(stored in MQC asTestCount.Failed)Errors(stored in MQC asTestCount.Errors)Inconclusive(stored in MQC asTestCount.Inconclusive)
MQC offers an additional structuring method, called Measurement described
in Section 13.4. Herewith, different Measurements with the same
BaseMeasure and Variable name can be read out. You can assign the measurement
name of MIL, SIL or PIL, which can be stated within the file name or the
PlatFormName with the following syntax _SIL_.
13.6. Razorcat Tessy
From the extract of the Tessy Example XML report,
<report success="notok" tessy_version="4.0.15" xml_version="3">
<statistic notexecuted="0" notok="11" ok="54" total="65">
  <category count="54" name="ok"/>
  <category count="11" name="notok"/>
  <category count="0" name="notexecuted"/>
</statistic>
<info date="2018-08-23" time="16:20:30+0200"/>
…
<tessyobject id="1024" level="0" name="Testsuite" success="notok" type="project">
MQC reads
from the main (
report) header:tessy_version(stored in MQC asTessyReportVersion)
from the
<statistics..>header the categories:oknotoknotexecuted.
from the
<info..>header:dateandtime(stored in MQC asReportDateTime)
from the
<tessyobject..>header:name(stored in MQC asArtifactName)type(stored in MQC asTessyObjectType)
The Tessy data is imported to the transformed ValueFact table maintaining the
same notation of the Tessy classification of ok, notok and
notexecuted, yet assigning them to the BaseMeasure TestCount.
13.7. MathWorks Polyspace
13.7.1. Polyspace Xml-adapter
If a Polyspace Xml report is created, MQC reads out from the xml-file:
PubDateTime(stored in MQC asReportDateTime)Subtitle(stored in MQC asArtifactName)PolyspaceVersionMISRA-C Checker.ViolationsMISRA-C Checker.Pass_Fail
This xml-file refers to several xfrag-files in the Polyspace-doc directory
to be found on the same level as the xml-file.
From the image-000-chapter.xfrag-file,
<title>Run-Time Checks Summary</title>
  <tgroup align="left" cols="2"><colspec colname="1" colnum="1" colwidth="600*"/><colspec colname="2" colnum="2" colwidth="600*"/><thead>
  <row bgcolor="#6A80BF">
    <entry>Run-Time Checks</entry><entry>Enabled</entry><?dbfo bgcolor="#6A80BF"?></row></thead>
  <tbody>
  <row bgcolor="#F0F2F9">
    <entry>Number of Red Checks</entry><entry>
    <emphasis role="red">0</emphasis></entry>
    <?dbfo bgcolor="#F0F2F9"?>
  </row>
  <row bgcolor="#FAFBFE">
    <entry>Number of Gray Checks</entry>
    <entry><emphasis role="gray">0</emphasis></entry><?dbfo bgcolor="#FAFBFE"?>
  </row>
  <row bgcolor="#F0F2F9">
    <entry>Number of Orange Checks</entry>
    <entry><emphasis role="orange">0</emphasis></entry>
    <?dbfo bgcolor="#F0F2F9"?></row><row bgcolor="#FAFBFE">
    <entry>Number of Green Checks</entry>
    <entry><emphasis role="green">220</emphasis></entry><?dbfo bgcolor="#FAFBFE"?>
  </row>
  <row bgcolor="#F0F2F9">
    <entry>Proven</entry>
    <entry>100.0%</entry><?dbfo bgcolor="#F0F2F9"?>
  </row>
  <row bgcolor="#FAFBFE"><entry>Pass/Fail</entry>
  <entry>-</entry><?dbfo bgcolor="#FAFBFE"?></row></tbody>
  </tgroup>
</table>
MQC extracts the following information, modifies and transformes it via predefined data table transformations:
Number of Red Checks(stored asRun-Time Checks.Majorin MQC)Number of Gray Checks(stored asRun-Time Checks.Minorin MQC)Number of Orange Checks(stored asRun-Time Checks.Moderatein MQC)Number of Green Checks(stored asRun-Time Checks.Goodin MQC)Percentage of Proven(stored asRun-Time Checks.Provenin MQC)Pass/Fail(stored asRun-Time Checks.Pass_Failin MQC)
13.7.2. Polyspace Text-adapter
If a Polyspace tab-separated Text report is created, MQC reads from this txt-file:
Last modified time of file(stored in MQC asReprtDateTime)FileFamilyColor
From the File column MQC extracts the file paths of all files used to
create the report. MQC then obtains the common prefix from these file paths
and extracts the last directory from the prefix.This is stored as the
Artifact Name in MQC.
For example if paths read from the “File” column are as follows:
E:\D42\A987R\InputOut\Swc_HMK\TLSim\Rte.cE:\D42\A987R\InputOut\Swc_HMK\TLProj\TL_Swc_WIM\Swc_WIM.cE:\D42\A987R\InputOut\Swc_HMK\TLSim\J_GLOBAL_STD.h
The common prefix is marked above and MQC extracts the last common directory
Swc_WIM as the artifact name.
MQC extracts from the tab-separated columns Family as base measure and
aggregated Color count as variable. MQC then modifies and transforms it
via predefind data table transformations as follows:
Family:Run-time Check and Color:Red(stored asRun-Time Checks.Majorin MQC)Family:Run-Time Check and Color:Gray(stored asRun-Time Checks.Minorin MQC)Famliy:Run-Time Check and Color:Orange(stored asRun-Time Checks.Moderatein MQC)Family:Run-Time Check and Color:Green(stored asRun-Time Checks.Goodin MQC)Family:Global Variable and Color:Gray(stored asGlobal Variable.Unused variablein MQC)Family:Global Variable and Color:Not Applicable(stored asGlobal Variable.Used non-shred variablein MQC)Family:MISRA-C(stored asMISRA-C Checker.Violationsin MQC)
13.7.3. Polyspace Tool Page
MQC provides an additional tool page showing details on data provided by Polyspace.
From the menu bar choose to add the Polyspace tool page.
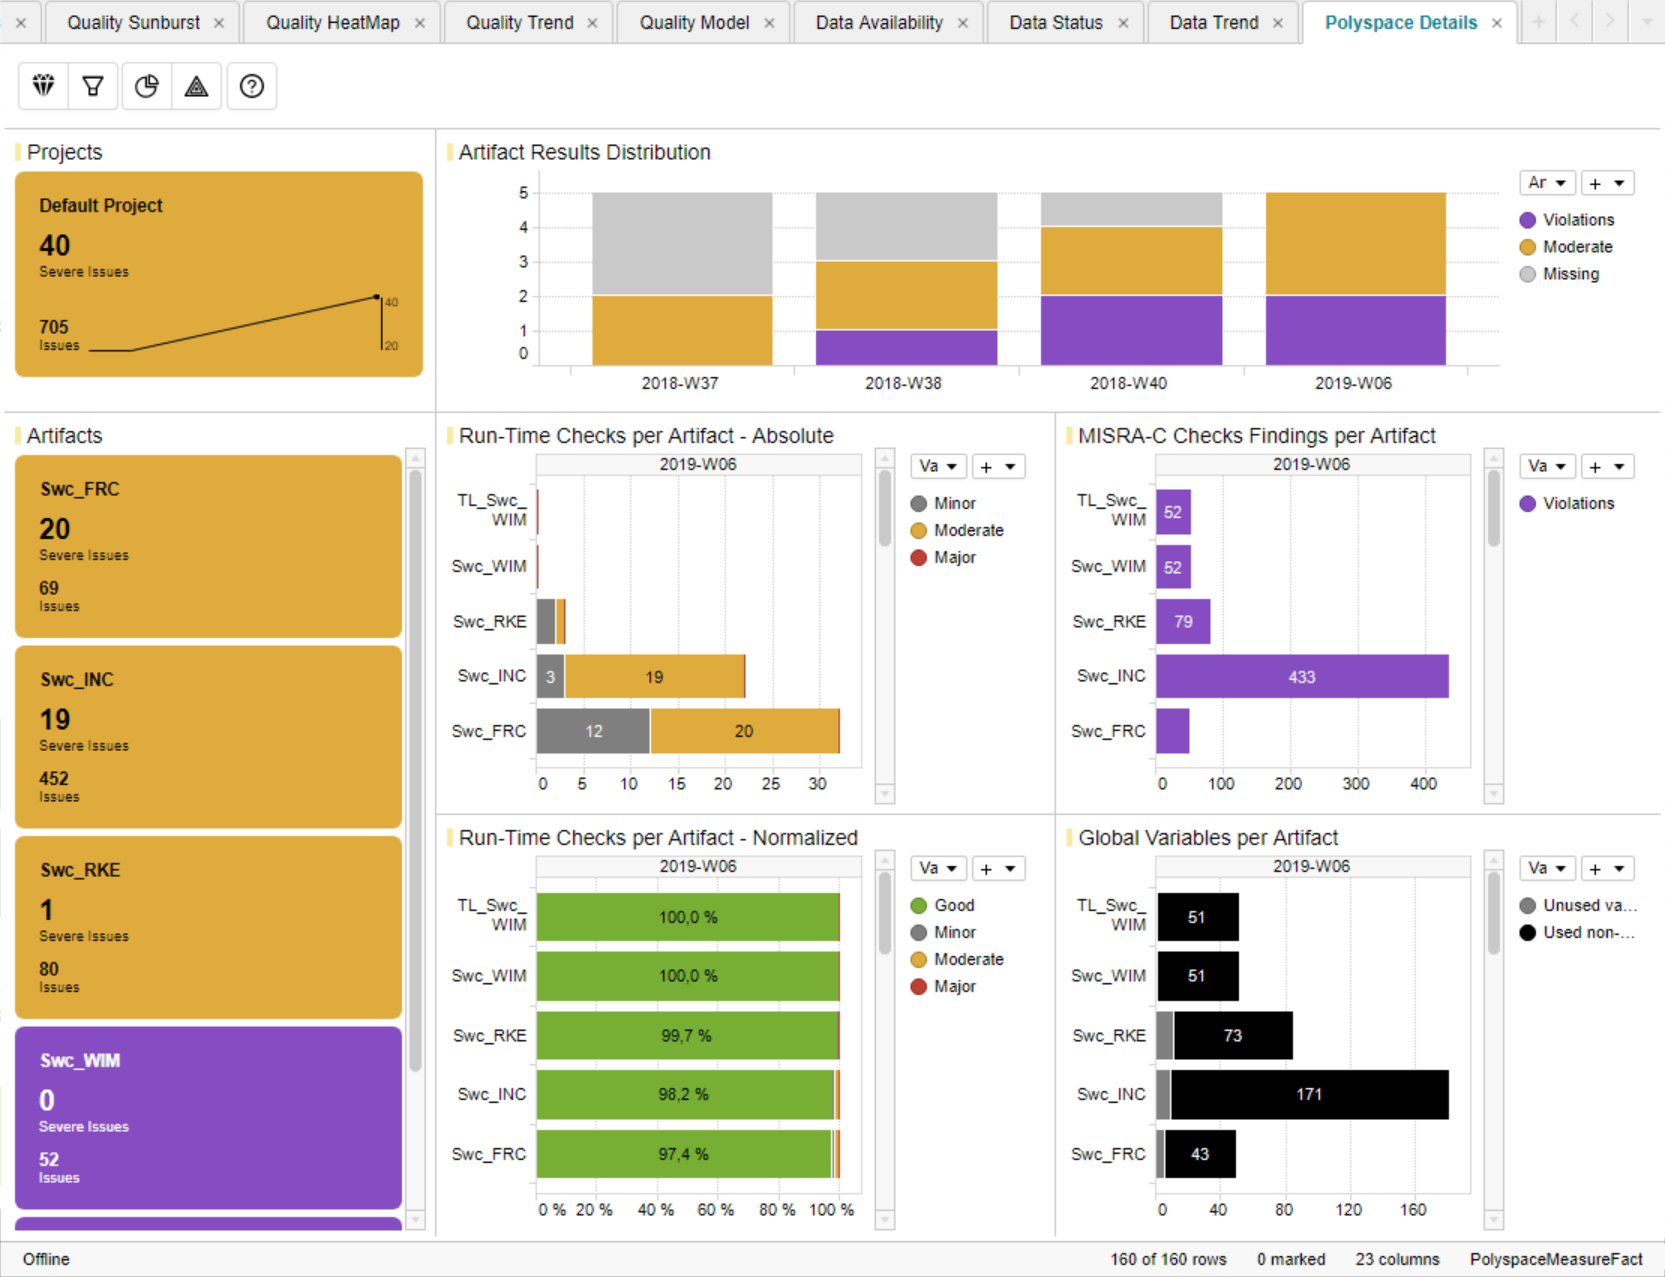
Figure 13.11 Polyspace Details Page
This page contains four main visualizations:
Run-Time Checks per Artifact - Absolute
Run-Time Checks per Artifact - Normalized
MISRA-C Checks Findings per Artifact
Global Variables per Artifact
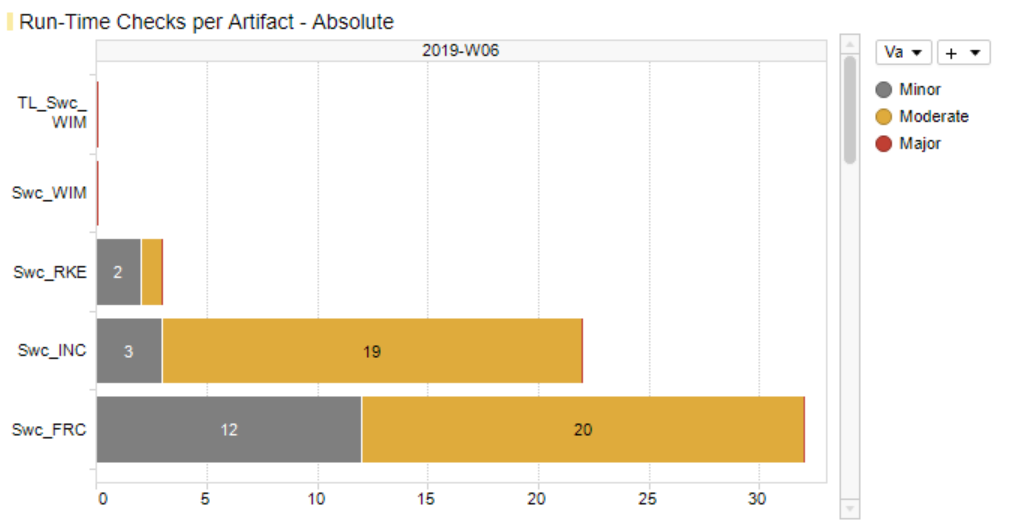
Figure 13.12 Polyspace Run-Time Checks per Artifact - Absolute
The first Run-Time Checks visualization (Figure 13.12) - top-left of the main visualization area - shows for each artifact the stacked absolute values of all findings excluding the number of green checks:
Run-Time Checks.Major(Number of Red Checks)Run-Time Checks.Moderate(Number of Orange Checks)Run-Time Checks.Minor(Number of Gray Checks)
This directly indicates the amount of still open and to be solved issues per
artifact without being concealed by a huge number of Run-Time Checks.Good.
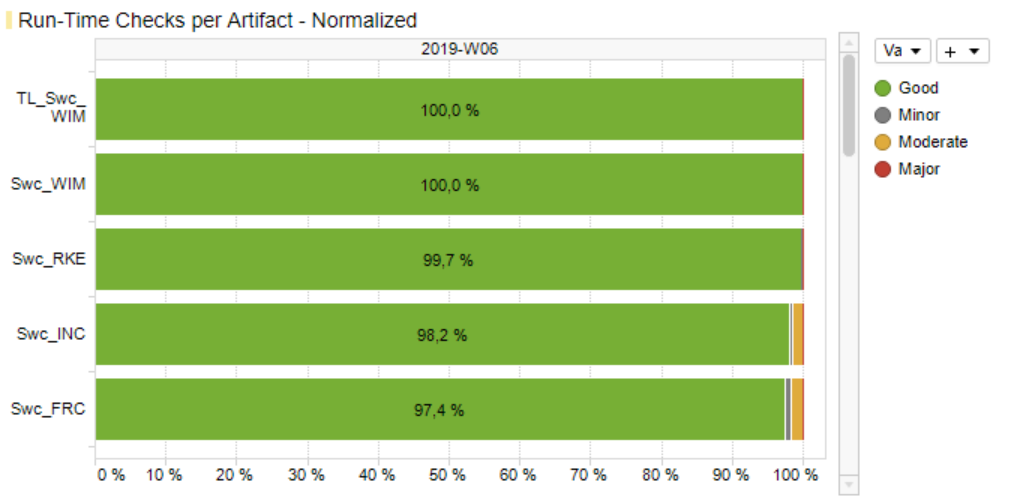
Figure 13.13 Polyspace Run-Time Checks per Artifact - Normalized
Figure 13.13 - at the bottom-left - also shows Run-Time Checks, but this time the relative share (in percent) of each result including the number of green checks compared to the overall number of findings per artifact.
The third main visualization (Figure 13.14) - top-right - shows the absolute number of coding rule violations per artifact.
If a Polyspace report contains different types of coding rule checks, e.g.
additionally custom rules, all violations found per artifact will be already
summed up by the Polyspace adapter to MISRA-C Checker.Violations and will
be shown as one value on the MQC data pages as well as on the Polyspace tool
page.
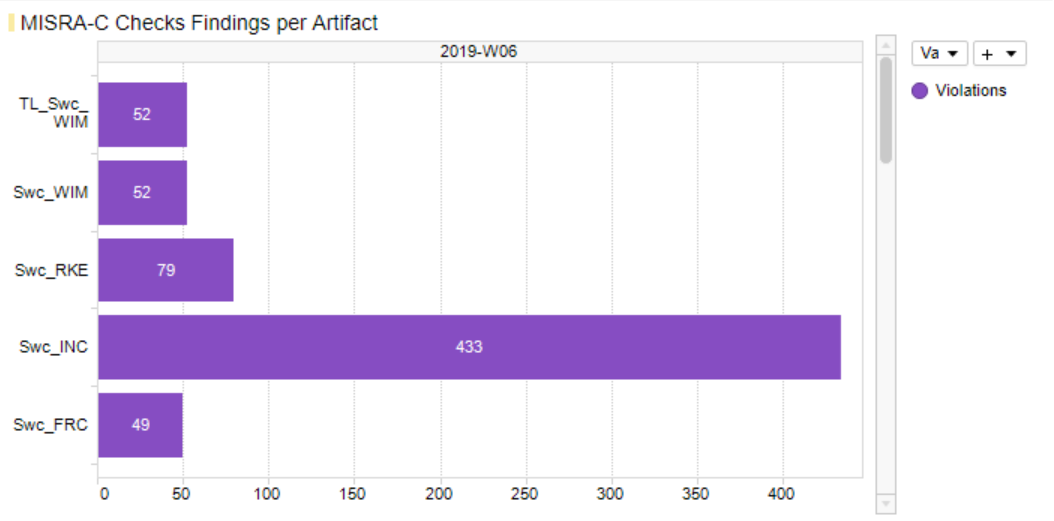
Figure 13.14 Polyspace Coding Rule Violations per Artifact
The forth main visualization (Figure 13.15) - bottom-right - shows for each artifact the stacked absolute numbers of global variables:
Unused variable(grey)Used non-shared variable(black)
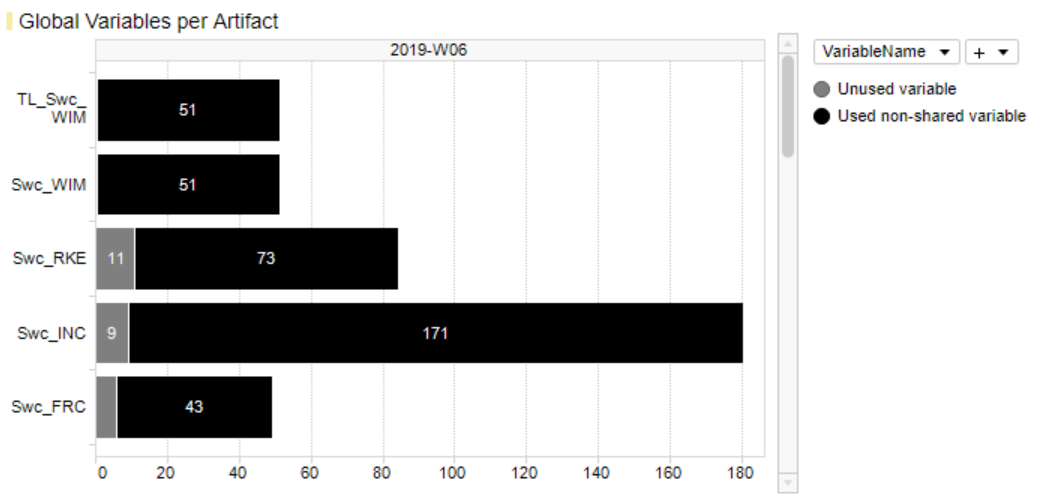
Figure 13.15 Polyspace Global Variables per Artifact
As long as data for multiple revisions is imported and no particular revision is marked respectively selected, all main visualizations offer to scroll between revisions to get the Polyspace results for a certain point in time.
The Artifact KPI on the left-hand side shows a tile for each artifact colored according to the number of found issues or severe issues, respectively.
Severe Issues:
Sum of all
Run-Time Checks.MajorandRun-Time Checks.Moderatefindings per artifact.Issues:
Sum of all
Run-Time Checks.Major,Run-Time Checks.ModerateandMISRA-C Checker.Violationsfindings per artifact.
If there is any Major finding, the artifact tile is colored red.
If there is no Major but Moderate finding, the artifact tile is colored
orange.
If there are no Severe Issues at all, but Issues (which means Violations >
0), the artifact tile is colored violet.
All other artifact KPIs are colored green.
The Artifact KPI on the left-hand side shows a tile for each artifact colored according to the number of found Severe Issues and Issues respectively. For the example in Figure 13.3 this means that within the current (last) revision there are four artifacts in total, one of them with severe issues (red bin), one with issues only (yellow bin) and two artifacts with no issues at all (green bins).
The Project KPI chart on the top-left of the page shows the color of the worst result over all artifacts as well as the overall number of Severe Issues and Issues for the whole project.
The distribution chart (top-right) shows for each revision the number of artifacts binned according to their worst result.
13.8. BTC EmbeddedTester
MQC supports two types of Embedded Tester (ET) report formats:
MQC XML report format (previous versions of ET)
13.8.1. Standard XML report format
If a standard XML report is created, MQC will read from the XML file:
<BTCXmlReport>
  <ProfileInfo lastArchitectureUpdate="Wed Nov 07 16:32:55 CET 2018" lastB2BTestExecution="Sat Aug 11 08:44:00 CEST 2018" lastRBTSILTestExecution="Wed Nov 07 16:39:43 CET 2018" lasteModifier="mes" modelName="TestObject.slx" modelVersion="0.0.1+STD" profileName="UT_TestObject.epp"/>
  <RBT>
    <Tests sumSILErrorExecutions="0" sumSILFailedExecutions="0" sumSILMissingExecutions="0" sumSILOutdatedExecutions="0" sumSILPassedExecutions="7" sumTestCases="7"/>
    <Requirements percentageSILPassedRequirements="100.0" sumRequirements="11" sumSILFailedRequirements="0" sumSILMissingOrOutdatedStatusRequirements="0" sumSILPassedRequirements="11"/>
    <SILFailedRequirements/>
    <RBTCoverageOverview>
      <Statement covered="77.33" handled="78.95" unknown="21.05" unreachable="1.62"/>
      <Decision covered="62.82" handled="65.38" unknown="34.62" unreachable="2.56"/>
      <MCDC covered="66.28" handled="68.6" unknown="31.4" unreachable="2.33"/>
    </RBTCoverageOverview>
  </RBT>
  <B2B>
    <Tests lastB2BTestName="TL MIL vs SIL" status="FAILED_ACCEPTED" sumErrorTests="0" sumFailedAcceptedTests="32" sumFailedTests="0" sumPassedTests="25" sumTests="57"/>
    <B2BCoverageOverview>
      <Statement covered="98.38" handled="100.0" unknown="0.0" unreachable="1.62"/>
      <Decision covered="97.44" handled="100.0" unknown="0.0" unreachable="2.56"/>
      <MCDC covered="97.67" handled="100.0" unknown="0.0" unreachable="2.33"/>
    </B2BCoverageOverview>
  </B2B>
</BTCXmlReport>
MQC extracts the following information, stores and transformes it to the MQC data structure, so that the imported data can be added to the ValueFact table as rows:
from the
<ProfileInfo>header:lastRBTSILTestExecution(stored in MQC asReportDateTime)modelName(stored in MQC asArtifactName)
from the
<RBTCoverageOverview>header:MCDC covered(stored in MQC asRequirement Based Testing.MCDC)
from the
<RBT>header:percentageSILPassedRequirements(stored in MQC asRequirement Based Testing.Test coverage)
from the
<BTB>header:sumTests(stored in MQC asStructural Testing.Nb Total)sumPassedTests(stored in MQC asStructural Testing.Passed)sumFailedAcceptedTests(stored in MQC asStructural Testing.Failed Accepted)sumFailedTests(stored in MQC asStructural Testing.Failed)sumErrorTests(stored in MQC asStructural Testing.Error)MCDC covered(stored in MQC asStructural Testing.MCDC)
13.8.2. MQC XML report format
If the MQC XML report is created, MQC is able to automatically import a great number of Base Measures:
Back-2-Back-Resultswith the following variables: -Errors-Failed-Failed (Accepted)-Passed-Total VectorsCode Coverage - Condition Coveragewith the following variables: -Covered-Handled-Tests-Unreachable (n/inf)Code Coverage - Decision/Branch Coveragewith the following variables:CoveredHandledTestsUnreachable (n/inf)
Code Coverage - Modified Condition/Decision Coveragewith the following variables:CoveredHandledTestsUnreachable (n/inf)
Code Coverage - Statement Coveragewith the following variables:CoveredHandledTestsUnreachable (n/inf)
Requirements Coveragewith the following variables:RequirementsRequirements CoveredRequirements Fulfillment
Test Execution Resultswith the following variables:ErrorsFailedFailed (Accepted)PassedTotal Vectors