14. Quality Model Configuration
As described in Quality Concept, MQC handles the imported data in such a way that quality can be structured and computed out of it. The configuration of the quality model including the definition of measurement functions to calculate measures for quality properties as well as the definition of base measures and derived measures have to be done in Excel. You can use the Quality Model Excel file provided by MQC as base for your configuration.
The quality model has to be imported (open the
dialog in the Configuration section of the menu and select the Load button)
and the chosen configuration will be applied by MQC.
If you do not have a proper Quality Model Excel file that can be adapted, you
can create one with the help of MQC. From the
dialog choose the Export button to export the quality model currently used
by MQC (which is the Default Quality Model, if no other quality model was
imported before). This provides you an Excel file that can be used as template
and where you can define your own project’s quality model.
If your imported quality model is changed, you can easily reload an adapted
quality model via the Reload button. Hovering over the Reload button
provides a tooltip, which helps you detecting name and filepath of the
currently imported Quality Model file.
The following sections provide information on how to configure the quality model and the intended quality structures in MQC.
14.1. Base Measures and Default Values
The “Base Measure” sheet of the quality model is used to define all base measures that you expect to be imported from a certain data source.
As described later in Derived Measures and Quality Properties, these base measures are used to calculate other measures, so-called derived measures, and – most important – quality measures, which are the base to compute quality.
For configuring base measures, MQC expects the following structure:
data source name
(default) measurement name
base measure name
variable name
default value
The data source is the tool, which is used to provide data to be imported into MQC. Examples are MXAM and MTest.
Typically, a measurement means the set of operations done to determine the value for a measure. For example this can be the name of a specific guideline document, which is used for the static analysis of a model, or the kind of test environment like MiL, SiL or PiL.
The measurement name configured in the “Base Measure” sheet is used as default, if a data source does not provide a measurement name.
If a tool adapter supports the possibilitiy to provide measurement names out of data files, the default is ignored and MQC uses the name provided by the tool adapter/data file.
Additionally, the “Base Measure” sheet provides you the possibility to define a default value per base measure variable. Please remember that base measures of the same type may be grouped (refer to Measures and Measurements), which results in a base measure containing multiple variable-value pairs.
Without default values, in case there are values missing for variables inside such a base measure group for a certain revision, a measurement function using these missing base measure variables could not be calculated. Therefore, MQC uses a configured default in case the data source has provided values for some base measure variables of a base measure group but not for all.
As an example, please imagine the base measure group FindingCount, which
contains the variables Canceled, Aborted, Review, Failed,
Unrepaired, Warning, Info, Repaired, Passed and
Ignored. If for a certain revision the data source does not provide values
for e.g. Repaired and Passed, MQC uses the default values for the
related base measure variables as defined in the “Base Measure” sheet (see
Figure 14.1). Hence, a
corresponding measurement function can be calculated.
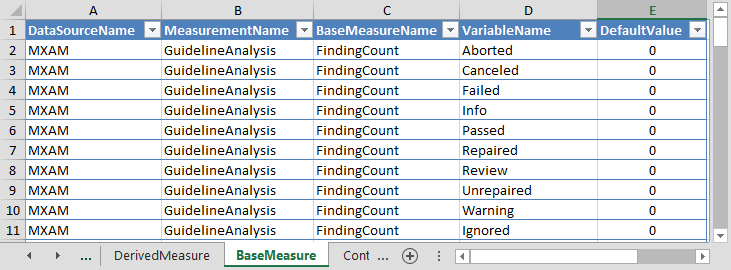
Figure 14.1 Defining default values for base measures not provided by a data source
Note
Please note, that in the “Base Measure” sheet of the quality model all expected base measure variables have to be defined. This is to assure that missing values can be substituted with the default values.
In addition, MQC uses default values only if a base measure variable inside a base measure group is missing! If the complete base measure is missing for a revision, no default values will be used!
In the case when base measures are completely missing in the current revision but values exist for any of the previous revisions, data propagation may be used to gain a full set of available information (see Data Propagation).
14.2. Derived Measures
Derived measures are computed either from base measures or from other derived measures as explained in Derived Measures.
This may be used to shorten the definition of measurement functions, which compute quality measures for quality properties (see Quality Properties).
If you would like to configure derived measures, this can be done using the “Derived Measure” sheet of the Quality Model Excel file.
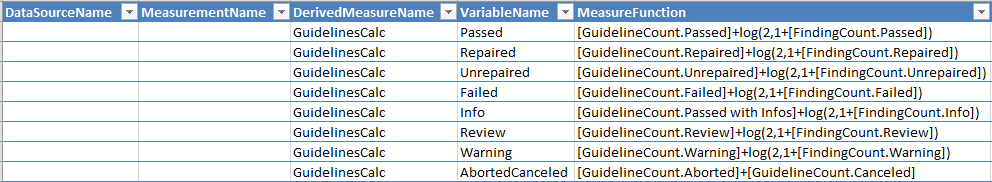
Figure 14.2 Defining derived measures using base measures provided by data sources
A fully qualified derived measure name consists of four parts (same structure as for base measures):
data source name
measurement name
derived measure name
variable name
With that you are able to define groups of derived measures, each group containing multiple variables.
The configuration of data source name and measurement name is optional. If nothing is set here, MQC takes data source and measurement from the base and/or derived measures used to calculate the derived measure.
Figure 14.2 shows the
definition of several derived measures that are computed from various
variables of the base measures FindingCount and GuidelineCount
provided by the data source MXAM. For example, the derived measure
GuidelinesCalc.Passed is calculated by the following measure function:
[GuidelineCount.Passed] + log(2, 1 + [FindingCount.Passed])
Note
As shown in the above example, base and derived measures used in a measure
function must be set in square brackets [ and ]!
You can define measure functions using a short notation for measure names only consisting of base / derived measure name and variable name (see Figure 14.2). MQC then checks for matching measures that were imported and replaces the used measure names by the fully qualified names.
If the quality model is exported (choose the Export button from the
dialog), the “Derived Measure” sheet of the
resulting Excel file contains the fully qualified names as shown in
Figure 14.3).
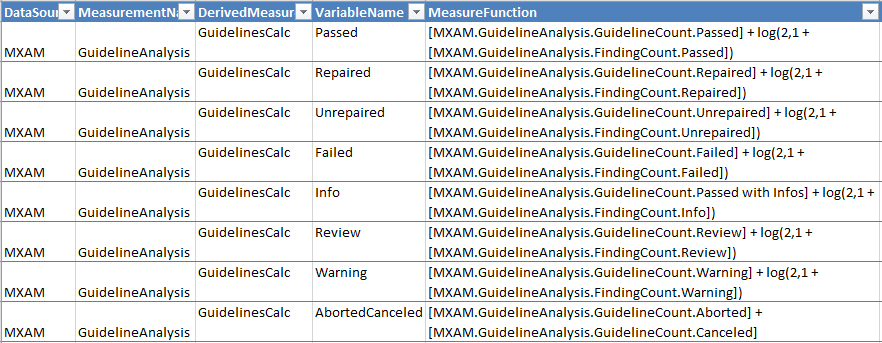
Figure 14.3 Derived measures with data source and measurement name set by MQC as well as measure function containing fully qualified measure names
If a measure function contains a base measure that exists for different
measurements, for example if FindingCount.Passed was measured multiple
times by checking compliance according to different guideline documents, MQC
calculates the corresponding derived measure for each of those measurements.
The same applies to measure functions containing derived measures calculated
for multiple measurements.
Note
If a derived measure is calculated for multiple measurements, the configured data source and measurement names will be replaced by data source and measurement from the base and/or derived measures used to calculate the derived measure.
To calculate a derived measure for a selected measurement only, please, use fully qualified measure names when defining the measure function (as shown in Figure 14.3).
14.3. Quality Properties
The “Quality Model” sheet is used to define the lowest level of computable quality namely quality properties. For each quality property a measurement function has to be defined that is used to calculate a quality measure between 0 and 1 by using base and derived measures.
Derived measures (see Derived Measures) can be used instead of base measures to simplify quality computation, hence, to shorten the formula of a particular measurement function.
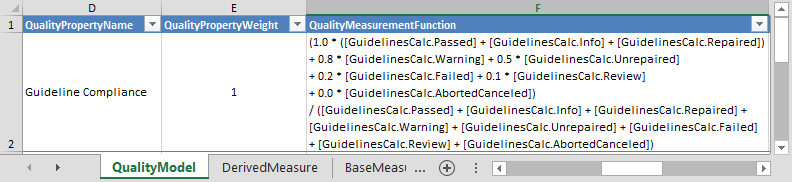
Figure 14.4 Reducing measurement functions by using derived measures defined on the “DerivedMeasure” sheet
Figure 14.4 shows an
example for a measurement function, where all base measure variables for the
base measures FindingCount and GuidelineCount were replaced by the
defined derived measures.
Note
As shown in the above example, base and derived measures used in a
measurement function must be set in square brackets [ and ]!
As for measure functions to calculate derived measures, you can define quality property measurement functions using a short notation for measure names consisting of base / derived measure name and variable name. MQC then checks for matching measures that were imported (base measures) or calculated (derived measures) and replaces the used measure names by the fully qualified names.
If a measurement function uses a base or derived measure that exists for
different measurements, for example if GuidelinesCalc.Passed was calculated
multiple times, MQC calculates the corresponding quality property for each of
the measurements.
Note
If a quality property is calculated for multiple measurements, the configured
quality property name will be extended by the name of the measurement, e.g.
Guideline Compliance_GuidelineAnalysis, whereas Guideline Compliance
is the defined quality property name and GuidelineAnalysis is the name
of the measurement.
To calculate a quality property for a selected measurement only, please use fully qualified measure names when defining the measurement function.
Additionally as explained in Quality Model Structure, quality in MQC is aggregated on different levels (as shown in Figure 6.4). MQC allows to assign quality properties with their measurement functions to sub-characteristics. Those sub-chracteristics again can be assigned to characteristics (see Figure 14.5). This enables the user to group quality properties in order to define different quality aspects, which may be analysed separately.
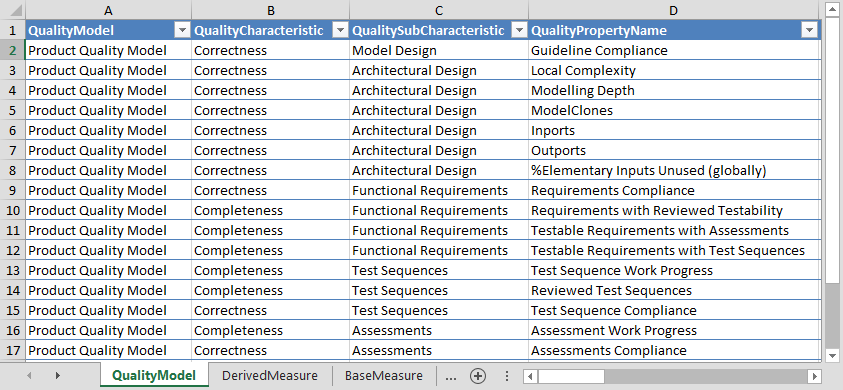
Figure 14.5 Define quality properties, measurement functions and quality model structures
The following sunburst visualization (Figure 14.6, lower right) illustrates the computation of the configured quality model.
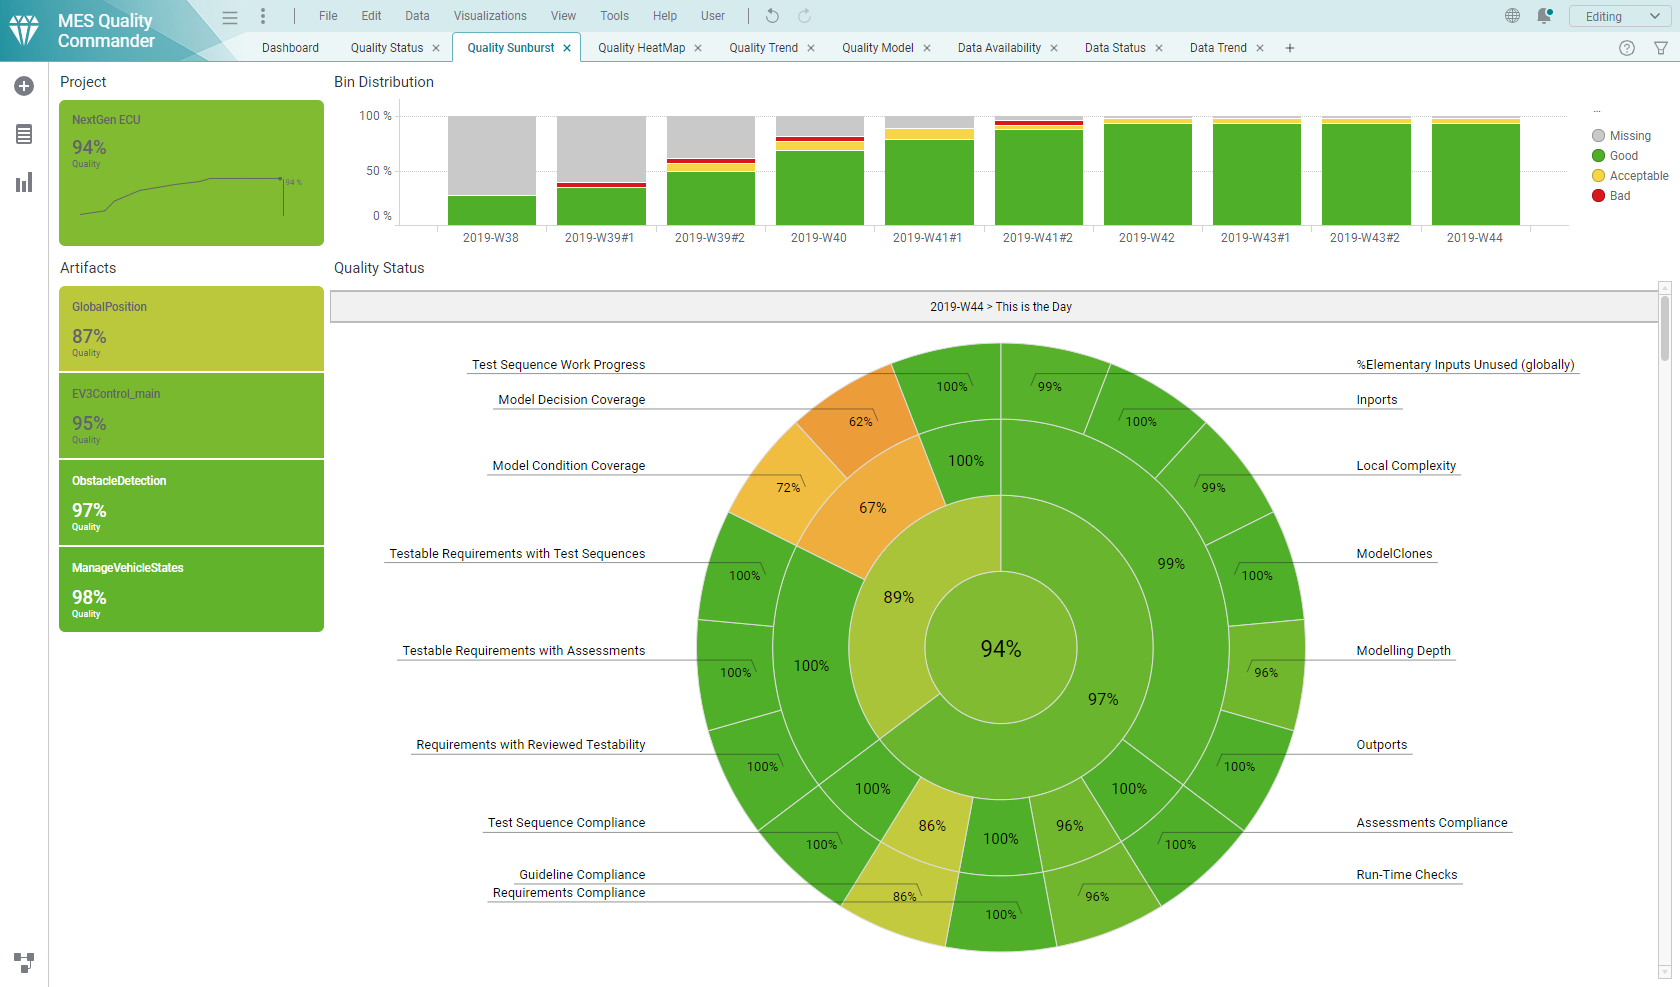
Figure 14.6 Computation of the overall quality illustrated using the sunburst visualization.
The outer ring of the sunburst consists of all quality properties defined by the quality model. Please note, each quality property is already aggregated over the artifacts (see Figure 6.6 in section Quality Aggregation).
The next ring shows the sub-characteristics defined by the quality model. A sub-characteristic is calculated using the average of all quality properties assigned to that sub-characteristic.
The third ring of the sunburst chart shows the configured characteristics. Each characteristic is calculated using the average of all quality properties assigned to all sub-characteristics belonging to that particular characteristic.
Finally, the inner circle shows the overall quality.
Note
By default, MQC uses all quality properties to compute the separate levels of the quality model, even if the measure value for a certain quality property cannot be calculated. This may be the case if all or a few measures, which are used to compute a quality property measurement function, are not available within a certain revision, i.e. not yet measured.
Missing quality properties are always treated as 0 when calculating the overall quality of a project.
MQC allows to exclude missing quality properties for the calculation. To
achive this, open the dialog in the Configuration
panel and enable the Exclude missing values check box under
Quality calculation title. This may be used to compute quality only for
those parts of a project, which are already available, respectively to
compute quality only based on those measures already provided.
In the example shown in Figure 14.6 all quality properties defined by the quality model are treated equally, means they have the same weight when computing the overall quality of a project. Nevertheless, MQC allows to give some quality properties a higher importance than others, which is explained in the following section (Quality Property Weights).
14.4. Quality Property Weights
MQC supports to define the relative importance of quality properties. In this way the weight of the process steps is mapped into the quality model. Herewith the result of the quality calculation is representing the process more realistically, similar to the definition of Artifact Weights.
In our last example (see Figure 14.6) all defined quality properties had the same weight of 1. Now we use different weights per quality property (Figure 14.7):
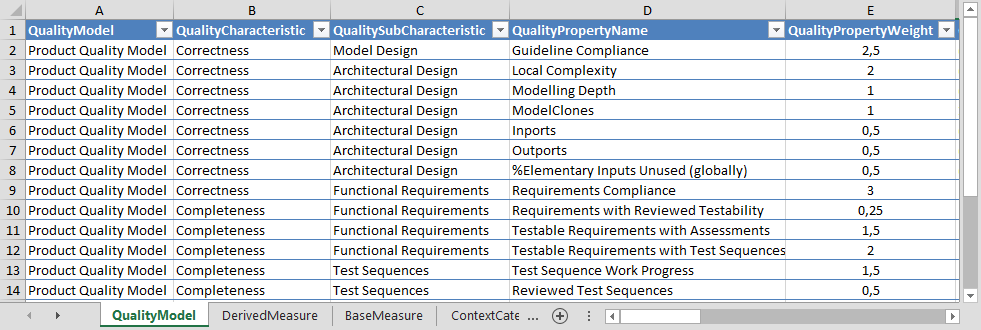
Figure 14.7 Quality property weight definition with unequal weights
After replacing the quality model (via the
dialog Load button in the Configuration section of the menu), the sunburst
visualization adapts as well as the quality measures calculated for
sub-characteristics, characteristics and the overall quality of the project.
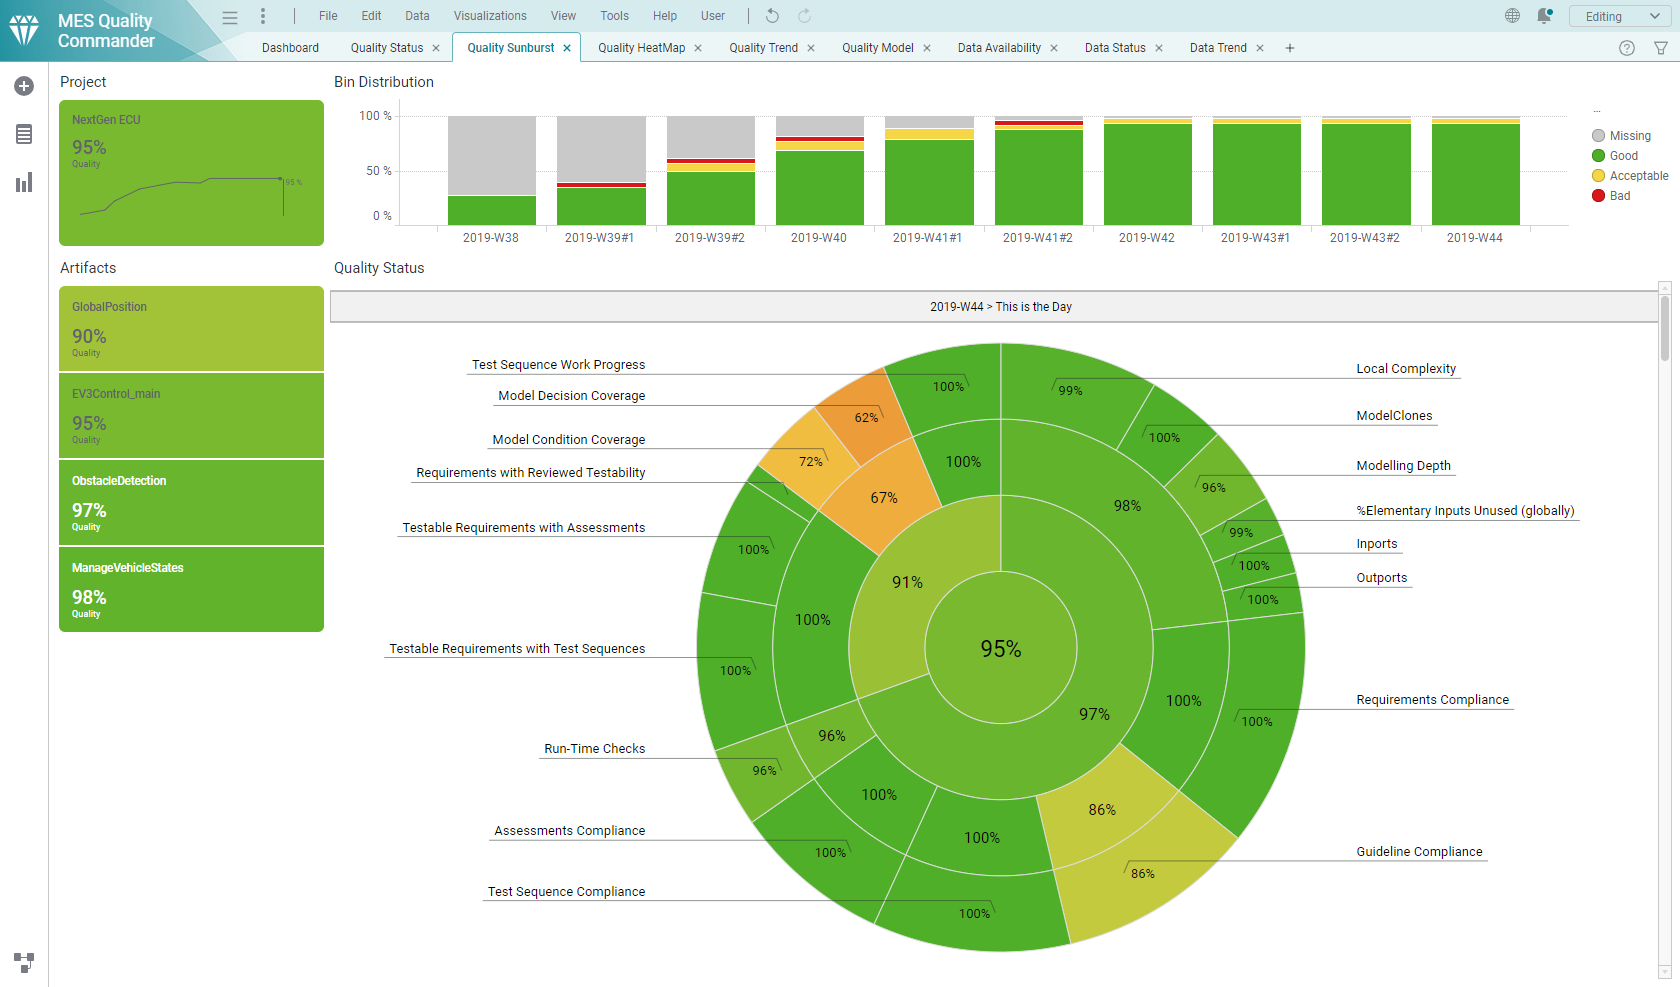
Figure 14.8 All quality properties now have a size according to their configured weights and are included with unequal proportions in the computation of the overall quality.
The size of each quality property tile (outer ring of the sunburst visualization) adjusts according to the weight of the quality property configured in the quality model.
Each level of the quality model now uses the weighted average for quality computation.
Finally, Figure 14.8 shows a different overall quality (inner circle of the sunburst chart) compared to the example with equal weights as shown in Figure 14.6.
14.5. Context Categories
By using context categories you can define, which data (on the level of base measures) is expected for a certain artifact. In that way, data never provided and therefore normally stated as “missing” - and probably resulting in bad quality - is treated as “excluded” data. This means it is excluded in availability and quality calculation.
Configuration of context categories is done in two steps:
assigning data to (or explicitly removing from) a context category is done via the “Context Category” sheet within the quality model configuration file, because this is directly related to the base measures defined here
assigning context categories to artifacts is done in the project structure configuration file, where the expected artifacts are defined
For a detailed explanation how to configure context categories please refer to chapter Context Categories.
14.6. Actions
The “Action List” sheet is used to define the recommended actions for improving the value of a specific quality property.
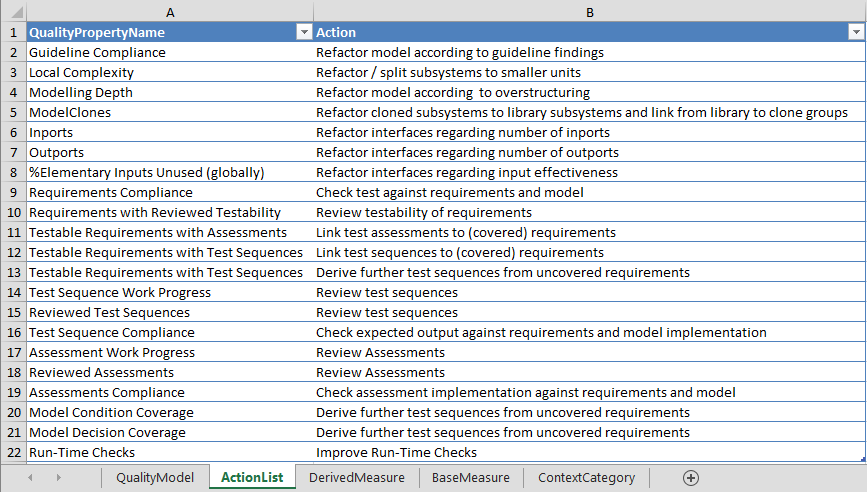
Figure 14.9 Defining recommended actions for improving quality properties
As shown in Figure 14.9, more than one action can be defined for one quality property, also one action can be assigned to more than one quality property.
For detailed information about Actions in MQC please refer to chapter Actions.
14.7. Quality Bin Configuration
Bins are used to group quality aspects of a project, i.e. a quality property per artifact for a certain point in time (revision), into categories (see Quality Bins). As per default, MQC uses the calculated quality measure value to assign a quality property to a quality bin.
Project specific quality bins may be defined in the “Bin” sheet of the Quality Model Excel file, where the number of bins is not fixed.
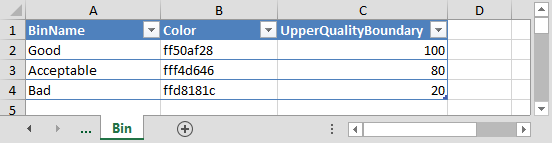
Figure 14.10 Defining a flexible number of Quality Bins using specific names and the respective colors
When defining quality bins, MQC expects the following information:
name of the bin
color
upper quality boundary
As color, MQC expects the hexadecimal color code without a leading #, e.g.
50af28 (green for default quality bin Good). Note that transparency
is optional, e.g. FF50af28 defines 100 % alpha transparency.
With the given upper quality boundary values MQC is able to define the value ranges for the configured quality bins. Quality measure values are between 0 % and 100 %. Therefore it is required to define an upper quality boundary of 100 % for the highest quality bin. Then MQC automatically takes the upper quality boundary of the next quality bin as the lower boundary (where the quality bins will be automatically sorted according to the given quality boundary values).
For the default configuration (see Figure 14.10) the resulting value ranges are as follows:
Good (green): ]80%, 100%]
Acceptable (yellow): ]20%, 80%]
Bad (red): [0%, 20%]
14.8. Quality Model Kit
To help you defining a proper quality model, MQC provides predefined
tool-specific quality property measurement functions as part of the
installation under the following path:
C:\Users\...\AppData\Local\TIBCO\Spotfire\10.3.3\Modules\MES.MQC.CoreExtension_X.X.X.X\Resources\QualityModel\.
This folder contains Quality Model suggestions for all Data Sources supported
by MQC. You will find examples, which allow you to easily assemble your own
project-specific quality model (including expected base and derived measures,
as well as proposed measurement functions) depending on the data sources you
are using within your project.
The following sections will give you examples based on MES data sources, which may help you to define your own measurement functions.
14.9. Quality Model for MES data sources
14.9.1. Quality Model for MXAM
In section Quality Properties there were already examples shown, how to define derived measures and quality properties, as well as a measurement function using measures provided by MXAM.
The defined derived measures are calculated using both, guideline results
(GuidelineCount) as well as check findings (FindingCount). Because of
the fact that the amount of check results typically is much higher than the
number of the guideline results, we use a log function to reduce the
impact of the check findings.
GuidelinesCalc.Passed = [GuidelineCount.Passed] + log(1 + [FindingCount.Passed], 2)
The MXAM quality model contains derived measures for all possible results, i.e.
Failed, Info, Warning and so forth.
Those derived measures are used in the measurement function for the quality
property Guideline Compliance, which is defined as follows:
(1.0 * ([GuidelinesCalc.Passed] + [GuidelinesCalc.Info] + [GuidelinesCalc.Repaired]) +
0.8 * [GuidelinesCalc.Warning] +
0.5 * [GuidelinesCalc.Unrepaired] +
0.2 * [GuidelinesCalc.Failed] +
0.1 * [GuidelinesCalc.Review] +
0.0 * [GuidelinesCalc.AbortedCanceled]) /
([GuidelinesCalc.Passed] + [GuidelinesCalc.Info] + [GuidelinesCalc.Repaired] +
[GuidelinesCalc.Warning] + [GuidelinesCalc.Unrepaired] + [GuidelinesCalc.Failed] +
[GuidelinesCalc.Review] + [GuidelinesCalc.AbortedCanceled])
As you can see, the measurement function calculates the weighted average of all derived measures.
There are two additonal MXAM derived measures defined.
IssueCount.Value which is the sum of all “bad” findings, i.e.
FindingCount.CanceledFindingCount.AbortedFindingCount.ReviewFindingCount.FailedFindingCount.UnrepairedFindingCount.Warning
SevereIssueCount.Value which is the sum of all “bad” findings not
considering FindingCount.Warning.
14.9.2. Quality Model for M-XRAY
The MXRAY quality model contains quality properties based on base measures provided by the data source M-XRAY.
As an example, the measurement function for Local Complexity is defined as
follows:
(1.0 * [Local Complexity.Good] +
0.8 * [Local Complexity.Acceptable] +
0.2 * [Local Complexity.Bad]) /
([Local Complexity.Good] + [Local Complexity.Acceptable] + [Local Complexity.Bad])
The same pattern may be used for Modelling Depth, Level, Inports,
Outports as well as for %Elementary Inputs Unused (globally).
14.9.3. Quality Model for MTest
The MTest quality properties are defined by comparing current and expected
results, which leads to quite simple measurement functions, e.g. the quality
property Requirements with Reviewed Testability is calculated as follows:
[Requirements with Reviewed Testability.Reached] / [Requirements with Reviewed Testability.Total]
Following this pattern, the MTest quality model additionally defines quality properties for:
Requirements ComplianceTestable Requirements with AssessmentsTestable Requirements with Test SequencesTest Sequence Work ProgressReviewed Test SequencesTest Sequence ComplianceAssessment Work ProgressAssessments ComplianceandReviewed Assessments.
14.10. Measurement function definition
This section aims to give you an overview on how to define your own quality properties or adapt your measurement functions.
You can use a bunch of mathematical functions provided within MQC.
Apart from the four basic arithmetic operations (+, -, * and
/), MQC allows to use: Abs, Exp, Ceiling, Floor, Round,
Ln, Log, Mod, Power, Product, Sqrt, Min, Max,
Avg, WeightedAverage, Case... when and IF... else.
In the following some of these functions are explained with their possible usage within a measurement function.
We already have seen
Log (2, n):Given the case you only have at your disposal certain base measure values, for that your quality property calculation tends to converge to 1 using basic arithmetic operations. Here you might consider to use Log function with basis 2 (please see the derived measure calculation in the example above Quality Model for MXAM.)
Note
For MQC 5.0 and lower, the log function is defined as log (n, 2).
Given the case that you want to avoid negative values in your measurement function, you can handle this at any time of its calculation using the
Abs-function, that returns the absolute value of the argument.
Abs([GuidelinesPassedCalc] - [GuidelinesInfoCalc])
or
Case... when:
case
  when ([GuidelinesPassedCalc] - [GuidelinesInfoCalc] < 0) then 1
  when ([GuidelinesPassedCalc] - [GuidelinesInfoCalc] > 0) then ([GuidelinesPassedCalc] - [GuidelinesInfoCalc])
  else 0
end
Powerreturns Arg1 raised to the Arg2 power.
Power(Arg1, Arg2)
ExpAnother useful application of mathematical functions could be the case of using the
Exp (argument)function, which returns e raised to the power of the argument.A linear function, such as in the first example (see below) might not be feasible to accurately adapt the Quality Property of ModelClones to your needs. Therefore, the second example shows a better function:
1.0 - ([ModelClones.Clones] / [ModelClones.Subsystems])
1.0 / Exp( 2 * [ModelClones.Clones] / [ModelClones.Subsystems])
AvgThis function calculates the average (mean) value of the input parameters:
Avg(parameter 1, parameter 2, ..., parameter n)