10. Actions and Configuration Menu
Per default the menu is enabled on all MQC pages. You can simply
switch it on or off by clicking the Menu icon within the MES Quality
Commander banner in the top-left.

Figure 10.1 Enable the menu within the MES Quality Commander banner
The MQC Menu is divided into Actions and Configuration.
10.1. Actions
10.1.1. Refresh Data
Once you have configured Data Sources and imported data, you can gradually import your file reports by copying new files / directories into the configured directories. To consider your newly added files/directories, press the “Refresh” Button.
Each time you update Adapters configuration, to consider your changes (e.g. adding custom adapter or disabling base adapter), press the “Refresh” Button.
Alternatively, you can enable the Automatic Refresh checkbox, so that MQC refreshes the specified directories and files automatically when changes are detected.
MQC searches all configured files and subdirectories recursively to load new file reports into the collection of your analysis.
Changes inside the added directories (new files, removal of files or even changes within the files) are automatically detected.
Figure 10.2 The “Needs refresh” status message appears due to changes within the monitored directories.
When clicking on the Refresh button the message will show to the “Data is up-to-date” status message, after the data has been refreshed.
10.1.2. Dashboard Customization
This action is available on the Dashboard page only. The dialog provides different options to customize your Dashboard (see Dashboard). Clicking on this option makes the Dashboard editable. In other words, the tiles become volatile and the visualizations can be changed.
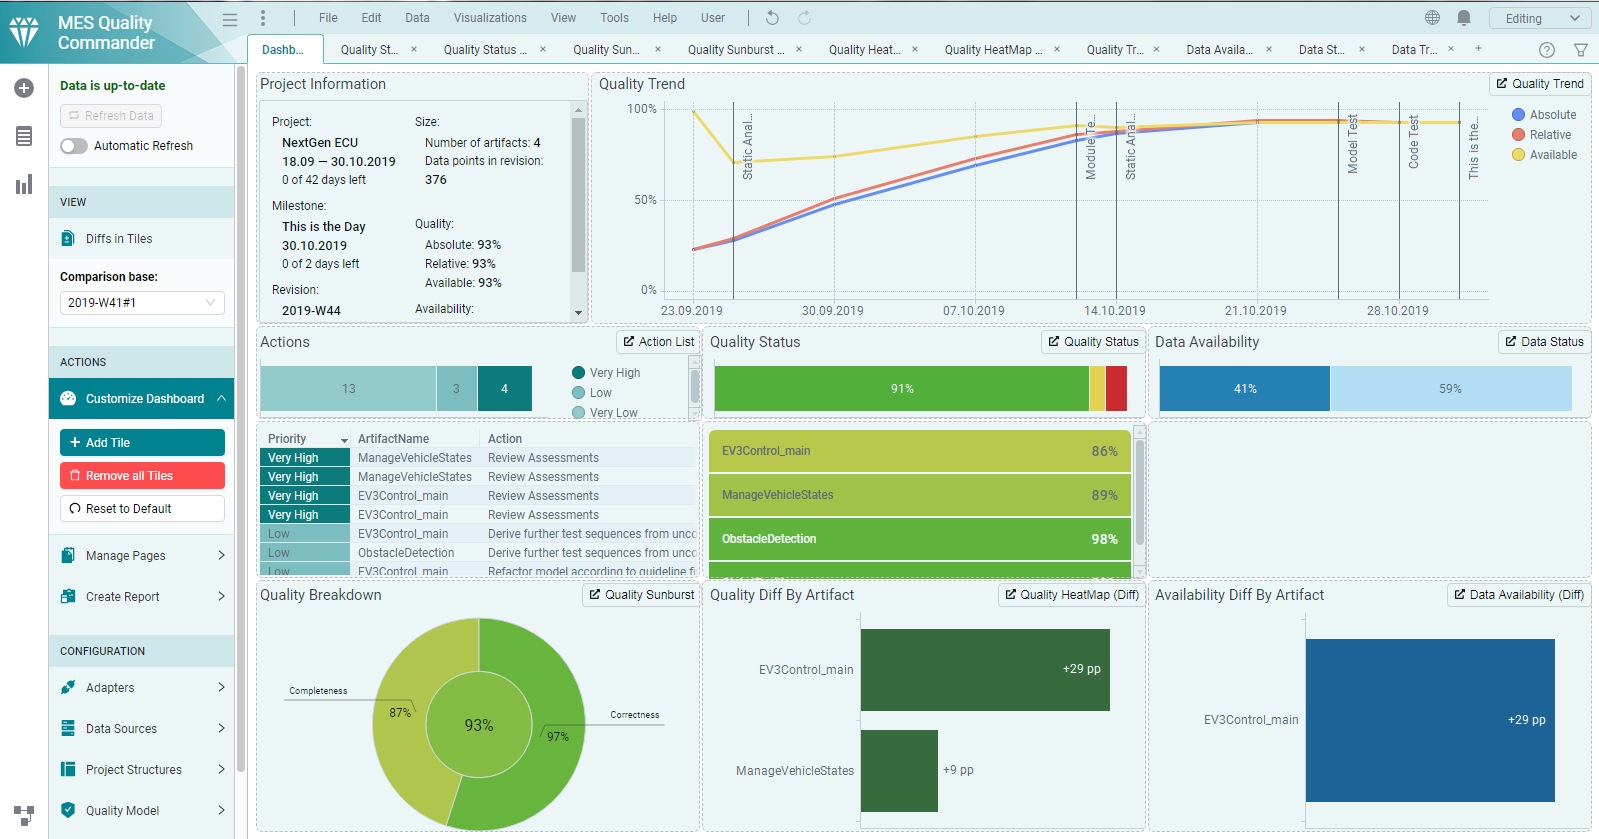
Figure 10.3 View of Dashboard in customizable mode.
The different customization options once the dashboard is in edit mode are as follows:
Resize, by hovering over the boundary of the visualization and drag it to obtain the desirable size. There is however a limit to the minimum size a visualization can get.
Remove, by hovering the visualizatiion and clicking the red button at the top right corner.
Rearrange, by dragging and dropping the visualization to another empty space of the same or larger size.
Additionally, a menu of options is present below the Customize Dashboard.
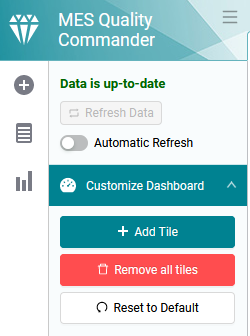
Figure 10.4 Menu options for customizing dashboard.
The Add Tile button opens a new dialog with different groups of tiles
(Project, Quality, Availability, Action and Tool) that can be added.
Simply select the tile of your choice and click on the Add button to
include it in the dashboard. If the minimum size of the tile cannot fit to the
available empty spaces then the tile cannot be added. If you would still like
to add another tile then close the “Add Tile” dialog and resize, rearrange or
remove existing tiles and try again.
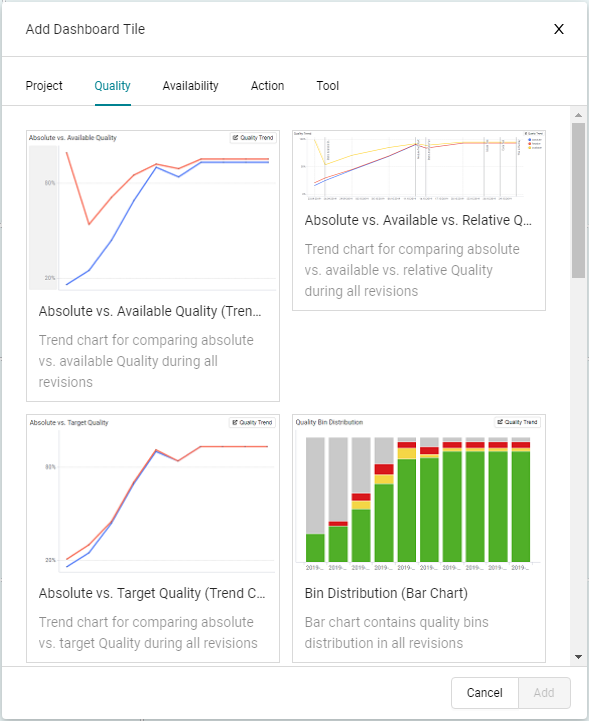
Figure 10.5 Add Tile dialog with tabs for different visualizations grouped by type.
The Remove all tiles button provides an easy way to get an empty dashboard
by removing all tiles so that you can add the tiles of your choice later.
Finally, the Reset to Default button will undo all the changes made and
reset the dashboard with the default tiles.
Note
All the customizations made to the dashboard are persistent when the dxp is saved.
10.1.3. Show Diff View
This navigates to the Diff Page of the current page (see Quality Diff and Availability Diff). It is only available for the Quality pages and for the Data Availability page.
10.1.4. Show Data Details
In this dialog you get a drill down from Quality to Data (see Data Details Drill Down). This is only available for Quality pages.
10.1.5. Show Data Origins
This dialog allows you to directly access the data reports imported by MQC (see Data Origins).
10.1.6. Manage Pages
This section contains all pages that exist in MQC, categorized in five groups (Quality, Data, Tool, Action and Custom pages) and additionally the Dashboard page. You can add or remove them by selecting or deselecting the checkboxes.
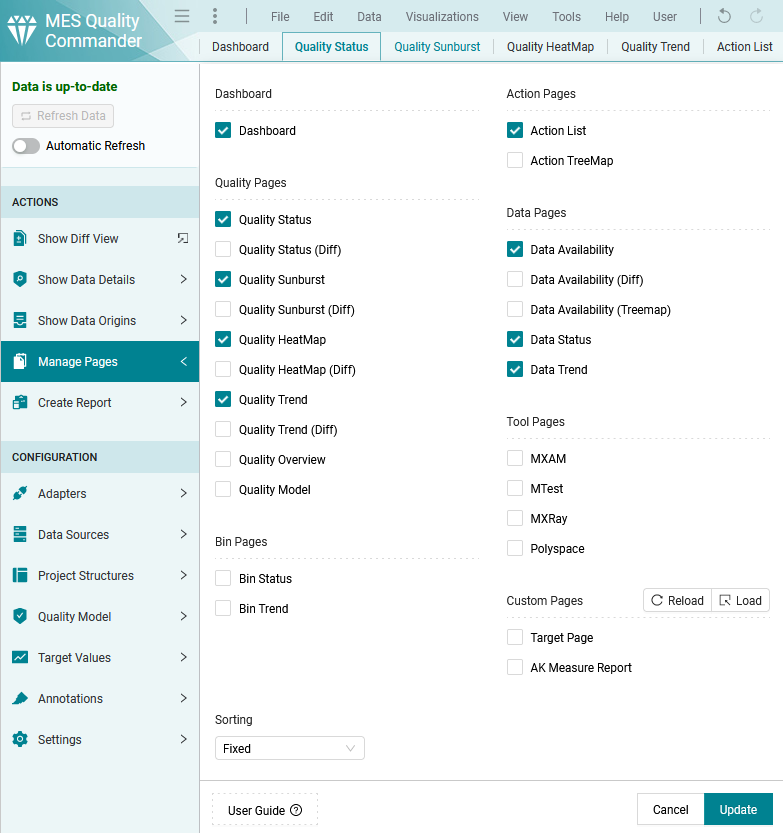
Figure 10.6 Pages dialog
The Dashboard checkbox allows you to select or deselect the creation of the dashboard in your project. Currently only one dashboard page can be enabled.
Quality pages include Quality Status, Quality Status(Diff), Quality Sunburst, Quality Sunburst(Diff), Quality HeatMap, Quality HeatMap(Diff), Quality Trend, Quality Trend(Diff), and Quality Model pages.
Data pages include Data Availability, Data Availability(Diff), Data Availability(Treemap), Data Status, Data Trend pages.
Action pages include the Action List and Action Treemap pages.
Custom pages: are defined in Custom Pages.
Sorting: there are two options for sorting pages (see Page order in the Pages dialog). By default the pages are in Fixed order. If Custom is selected for ordering, new pages are added after existing pages.
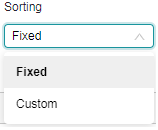
Figure 10.7 Page order in the Pages dialog
Note
To apply changes in the Manage Pages dialog you have to click
on the Update button.
10.1.7. Create Report
In this dialog you can create a Status Report (see Status Report).
10.2. Configuration
The bottom of menu contains all configurations of the analysis.
10.2.1. Adapters
In this dialog you manage adapters (see Custom Adapters).
10.2.2. Data Sources
Users can import either single files or directories by clicking on the Data Sources section and select files or directories that contain file reports. For more information about data sources, refer to chapter Data Sources.
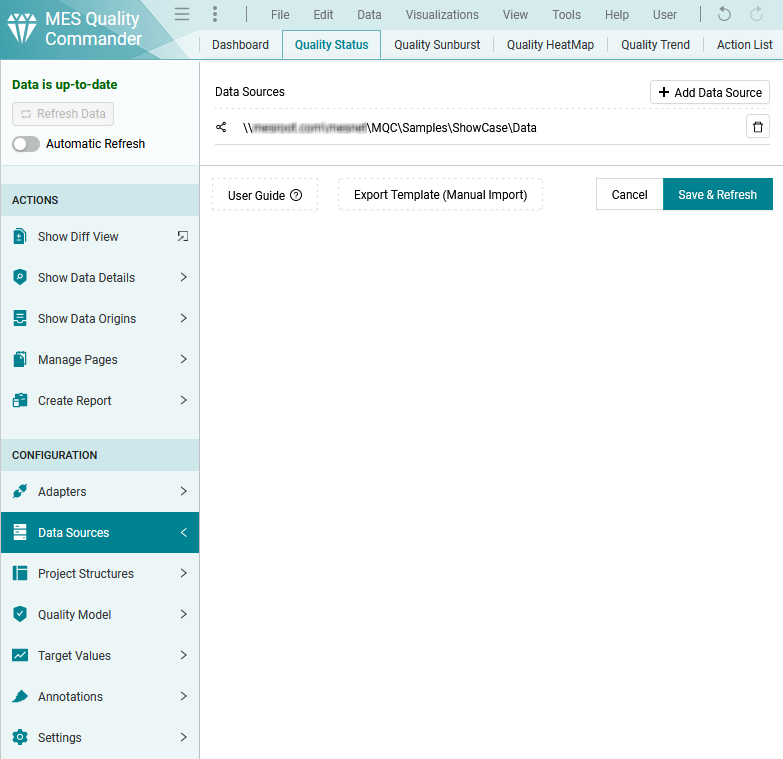
Figure 10.8 Configure Data Sources by adding files and/or directories
10.2.3. Project Structures
Users can load, export or reload the Project Structures excel configuration (please refer to Project Structures Configuration for more information).
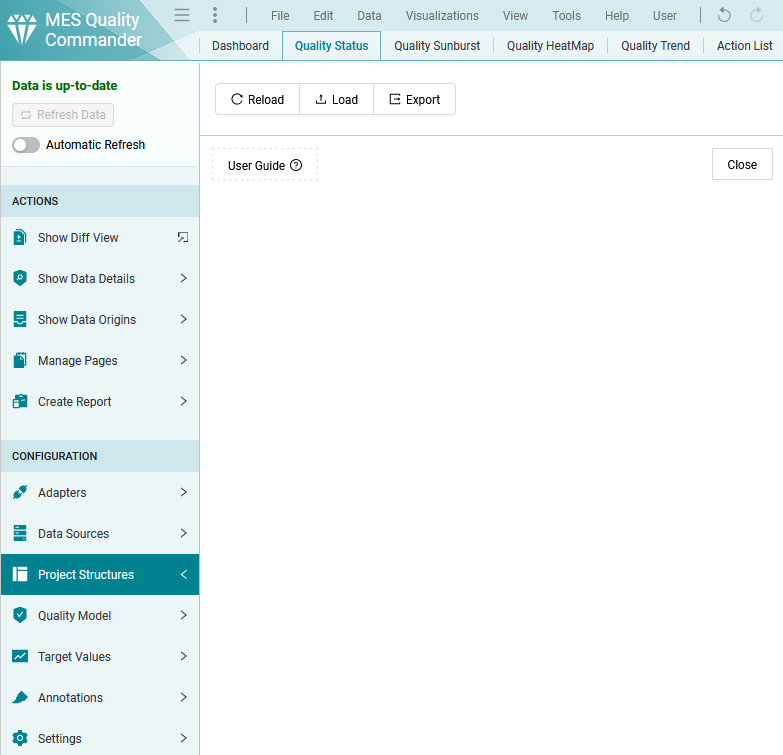
Figure 10.9 Configure Project Structures
10.2.4. Quality Model
Users can load, export or reload the Quality Model excel configuration. A default Quality Model is provided with MQC (please refer to Quality Model Configuration for more information).
10.2.5. Target Values
Users can load, reload or remove the Target Values excel configurations (please refer to Target Values for more information).
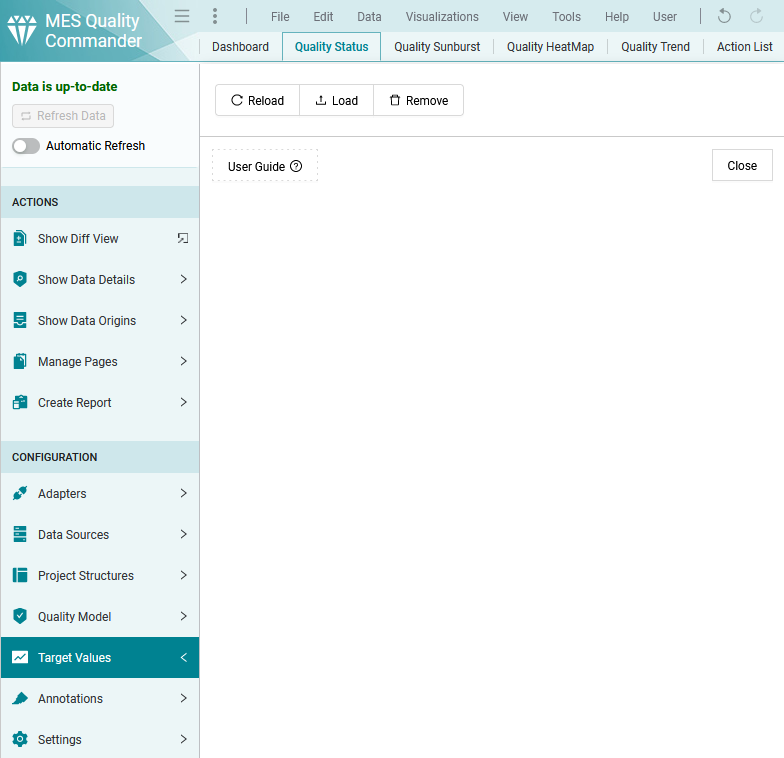
Figure 10.10 Configure Target values
Note
In the Project Structure, Quality Model and Target Values dialogs the Reload button is only visible when a configuration file has already been imported. A tooltip shows the paths to the currently loaded file.
10.2.6. Annotations
Users can justify the calculated quality to document deviations of expected values. Additionally it is also possible to change a quality bin (i.e. from bad to acceptable) or the quality value directly if necessary (please refer to Annotations for more information).
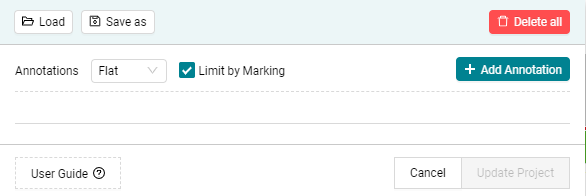
Figure 10.11 Add Annotations to justify the quality of the quality properties and artifacts in your project
10.2.7. Settings
This section contains a group of settings:
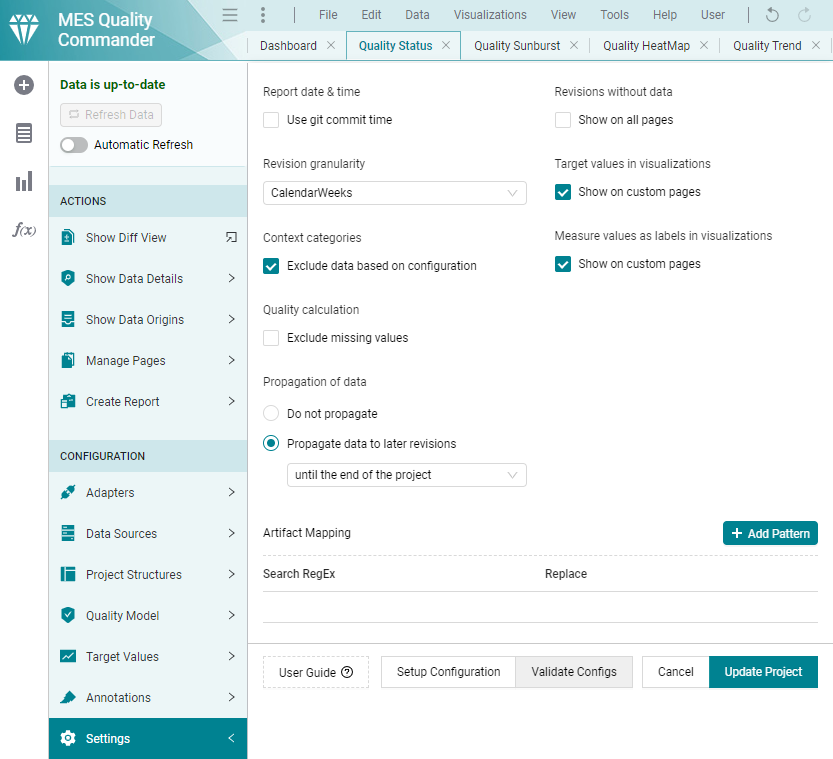
Figure 10.12 Settings dialog
10.2.7.1. Report date & time
If enabled, the checkbox enables the use of the git commit date and time as the report date-time. This only works if the corresponding data source is of the git type. By default or if not checked, the report date-time is taken from within the reports or the creation date of the report based on the respective data source adapters.
10.2.7.2. Revision granularity
Can be used to change the degree of compactions of the revisions for which data exists to better visualize your trend line charts. The revision granularity can be selected depending on your needs (see Figure 10.13).
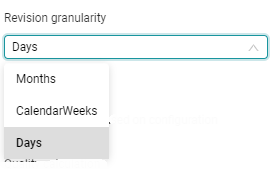
Figure 10.13 The default revision granularity is Days, but it might be useful to change it to CalendarWeeks or Months
10.2.7.3. Context Categories
10.2.7.4. Quality Calculation
(see Quality Properties)
10.2.7.5. Annotations
Apply the defined annotations to the quality of your project. (see Annotations)
10.2.7.6. Propagation of data
(see Data Propagation)
10.2.7.7. Revisions without data
10.2.7.8. Target values in visualization
10.2.7.9. Measure values as labels in visualizations
10.2.7.10. Artifact Mapping
MQC provides a different possibility to map artifacts (for more details please see Artifact Mapping) in case you do not have your project structure ready yet. For that, you need to define regular expression patterns which can map artifact paths to artifact names.
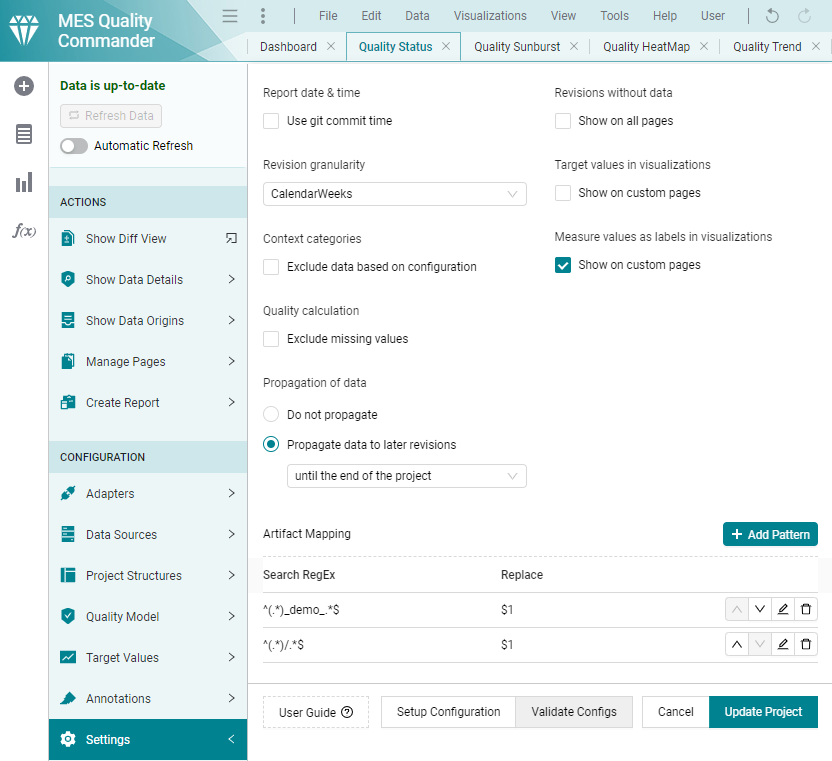
Figure 10.14 Artifact Mapping in settings section of configuration menu
By pressing the Add Pattern button, a new dialog Artifact Mapping Pattern is opened. Here, you can define the Search RegEx and Replace values and the effective result can also be directly seen on the pageable list.
For example in Figure 10.15
, the pattern is defined as: Search RegEx: ^(.*)_demo_.*$ , Replace: $1, which means the
artifact name is the substring of artifact path before _demo_.
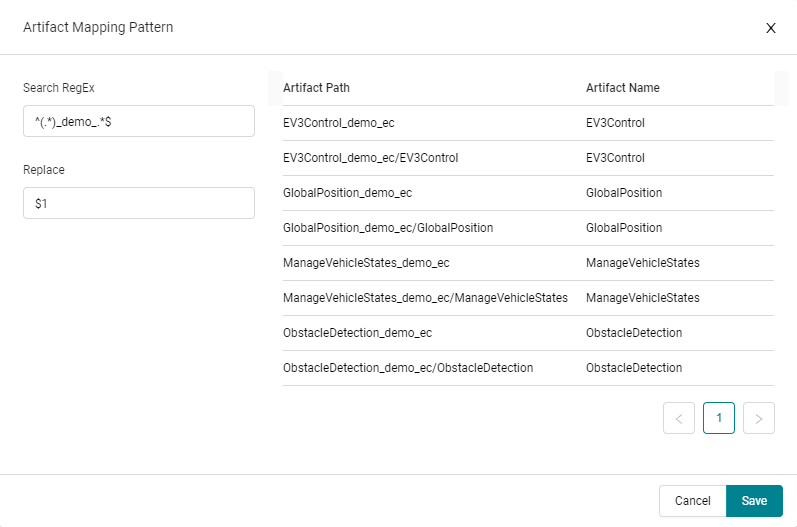
Figure 10.15 Define new pattern for artifact mapping
As you can see in Figure 10.14, more than one pattern can be defined. The first matching pattern from the list will be applied to the artifact path. The order of the patterns can be changed in the list. The result of these patterns are also present in the export of artifact structure.
Note
These artifact patterns will be applied until there is no project structure imported otherwise artifact mapping in project structure configuration has more priority.
Note
To apply changes in the Settings dialog you have to click on the Update
button.