3.7. Report
MQC allows the creation of a status report summarizing the most important data in visualizations and tables. This report is designed for browsing (HTML) and print (PDF).
To create a new Report, go to File > Create Report in the MQC menu.
It is important to note that the active settings from the filter panel are applied for the creation of the report, opening up a more in depth customization of the displayed data.
Active markings, in contrast to filters, are not applied in the creation of the report.
3.7.1. Options
The report configuration dialog allows an extensive configuration of the contents contained in the report.
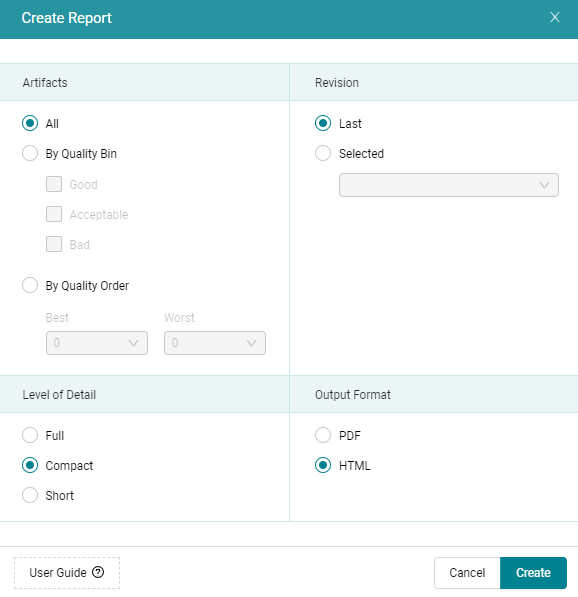
Figure 3.22 The dialog allows the configuration of specific settings for the report.
3.7.1.1. Artifact Selection
The artifacts to be included in the report can be selected either by Quality Bin (please refer to Bins) or by Quality Order. If you select by Quality Order you can choose a number of Artifacts with the best and/or worst aggregated quality that will be contained in the report.
3.7.1.2. Revision Selection
You can select the revision, the report will be created for, to be the last revision or a specific one.
3.7.1.3. Report Type
Three different report types are available to choose from: Full, Compact, and Short. Every report type displays relevant data and visualizations of the following categories.
Full |
Compact |
Short |
|
|---|---|---|---|
Quality Overview |
✓ |
✓ |
✓ |
Data Availability Overview |
✓ |
✓ (*) |
✓ (*) |
Data Trend Overview |
✓ |
- |
- |
Data Status Overview |
✓ |
- |
- |
Artifact Details |
✓ |
✓ |
- |
Quality Property Details |
✓ |
✓ |
- |
User Configured Custom Pages |
✓ |
✓ |
✓ |
Configuration Information |
✓ |
- |
- |
Annotations |
✓ |
✓ |
- |
* Does not contain the “Missing Base Measures per Artifact” table.
3.7.1.4. Output Format
You can chose between two different output formats namely PDF or HTML.
After clicking on Create the report will open within the default viewer on your platform, where you can save it from.
3.7.2. Content
3.7.2.1. Report and Project Information
The Report Information shows the configurations of the report and the creation date. In addition it contains the project name, information regarding the due date of your milestones, the overall availability value and overall quality value.
The Project Information is a summary of the project for the selected revision.
3.7.2.2. Quality Overview
This section contains the most important visualizations and information of the Quality page in MQC. Additionally, quality status information for the selected revision per Artifact as well as per Quality Property are available in tables.
3.7.2.3. Data Availability Overview
In the Data Availability Overview the Availability Distribution shows the data availability over time.
The Availability Matrix and the Availability Status is shown only for the selected revision of the report.
Special attention is paid to missing data. Not yet imported base measures are listed per artifact and data source. Please note, this information is included only when the report type “Full” is selected.
3.7.2.4. Data Trend Overview
For the Data Trend Overview the measure trend by artifact visualizations present the base measure values per artifact across all revisions.
3.7.2.5. Data Status Overview
The Data Status Overview provides a data status visualization for each data source for the selected revision.
3.7.2.6. Artifact Details
The Artifact Details section shows, per artifact, the Quality Trend as well as the Quality Status for all quality properties. The Quality Status is only shown for the selected revision.
Additionally a table for the selected revision with the quality property values is included, which can also be used to directly navigate to the corresponding part of the Quality Property Details.
3.7.2.7. Quality Property Details
The Quality Property Details section shows the Quality Trend by Artifact as well as the measurement function, which is used to calculate the quality from the imported data for each quality property.
Additionally a table is shown that displays the data for all measures inside the measurement function for each artifact, as well as the file source from which the data was read. The table cells inside this table are either displayed white for available, blue for propagated or grey for missing.
Much like in the Artifact Details, this table can be used to directly navigate to the corresponding part of the Artifact Details section.
3.7.2.8. User Configured Custom Pages
The user configured custom pages are dependent on the configured pages in MQC (for more details refer to Custom Pages). The status and trend visualizations for each page are shown.
3.7.2.9. Configuration Information
This section provides an overview for all imported configurations divided into Quality Configurations, Structure Configurations and Other Configurations.
The Quality Configurations include:
the Quality Model Configuration
the Actions Configuration
the Derived Measure Configuration
the Base Measure Configuration
the Context Categories Configuration
the Quality Bin Configuration.
The Structure Configurations include:
the Project Milestone Configuration
the Artifact Structure Configuration (incl. Context Categories and Artifact Mapping).
Other Configurations include the user configured Custom Page Configuration.
3.7.2.10. Annotations
The Annotations section contains all Annotations that are valid for the selected revision. The Annotations are grouped by Artifact.