3.5. Custom Pages
Custom pages as shown in Figure 3.20 are pages created by an editor of MQC to focus on specific information, base measures, derived measures, or quality properties.
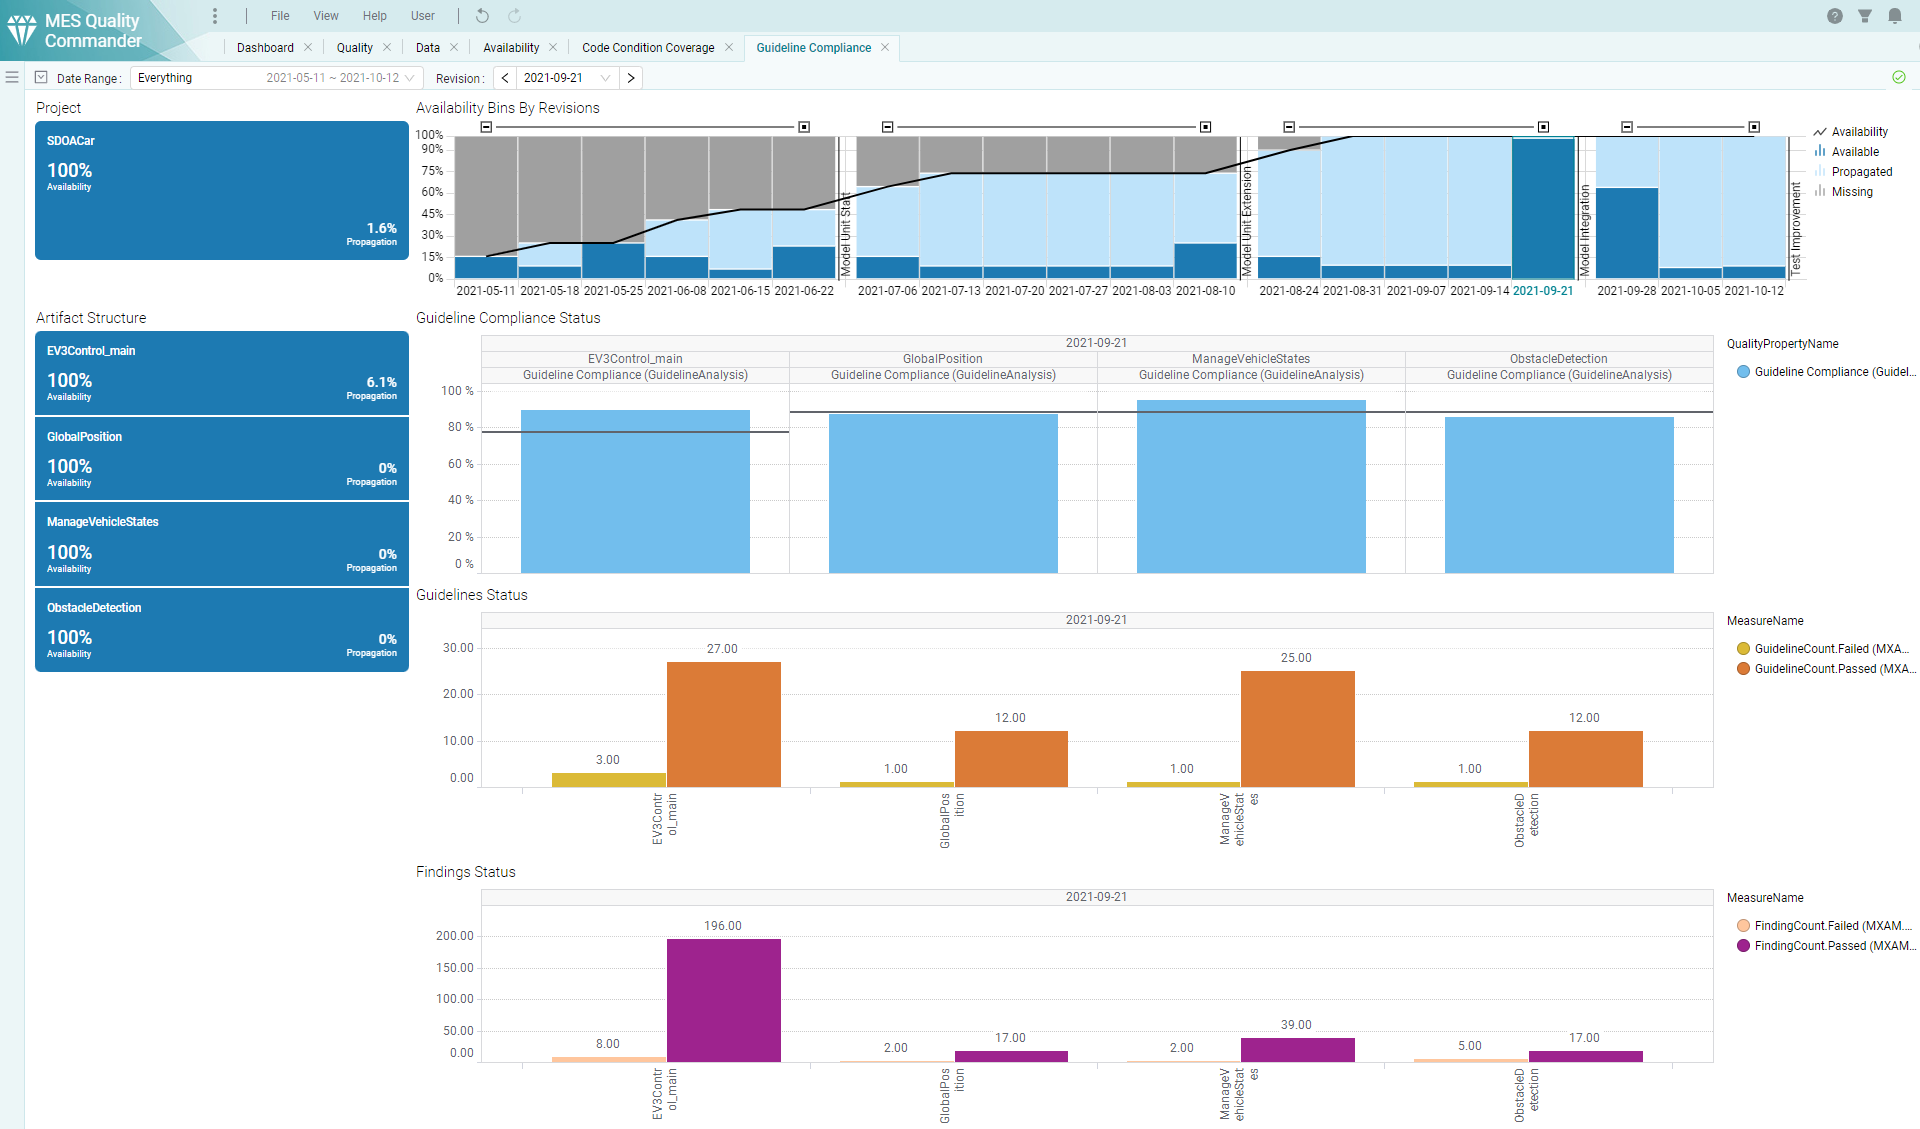
Figure 3.20 Custom page showing selected base measures and quality properties
Each custom page may show:
multiple visualizations: trend or status
multiple measures per visualization: quality or data
combinations of quality and data visualizations
expectations (targets) per measure - as separate dashed lines with the same color in trend visualizations - as horizontal lines in status (bar) visualizations
a label per measure depicting the actual value of that measure
An Artifact KPI visualization on the left-hand side may be used to focus on specific artifacts.
The toolbar for custom pages consists of the Date Range Selection and the Revision Selection.