6. Quality Concept
This chapter explains how MQC computes quality based on the imported data, derived measures (both are introduced in Derived Measures) and a Quality Model. Additionally it describes how quality is structured in MQC.
6.1. Quality Computation
When data is collected and imported in MQC, it is handled in terms of measures. In the following, we consider one artifact and one revision.
A measurement – that is the set of operations executed to determine values for measures – is applied and it yields a collection of measures including their measure values. Either these measures can be base measures coming directly from the data source or derived measures, i.e. computed from base measures or other derived measures (see Figure 5.11).
Two or more of these base and derived measures are used to calculate a quality measure between 0 and 1. This quality measure is associated to a so-called quality property. Quality properties define the lowest level of computed quality. Examples of quality properties are “Guideline Compliance” or “Test Sequence Compliance”.
For each quality property, a measurement function defines how to calculate the quality measure by using base and derived measures.
Note
Quality measures always need to be between 0 and 1. This is ensured by MQC even if the measurement function yields a value outside these boundaries.
The workflow from measuring the data to calculating the quality measure for a quality property is given in Figure 6.1.
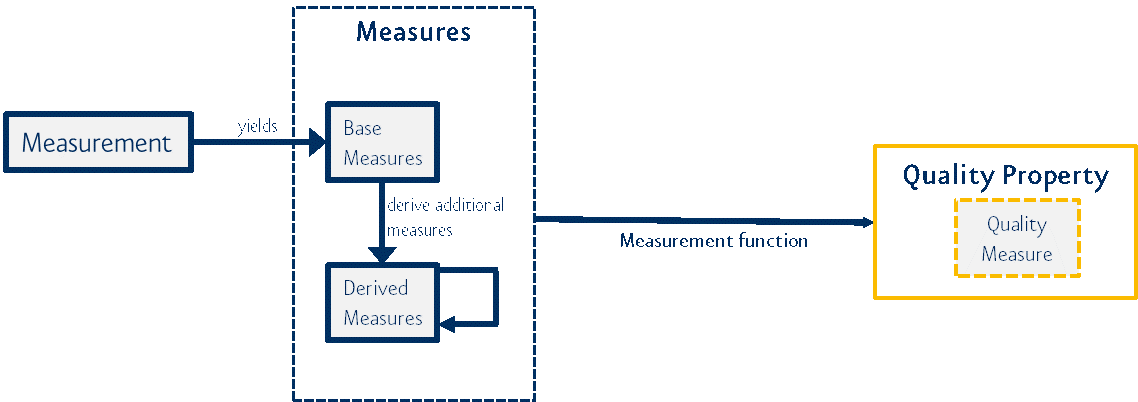
Figure 6.1 Workflow from collecting data with a measurement to calculating a quality measure by a measurement function
Please note that the quality measure value of a quality property can also be calculated by using more than one measurement. In this case, the measurement function to compute the quality measure is used for all the measurements from the same data source. Afterwards the results are aggregated to an overall quality measure value. One example is the quality property “Guideline Compliance”, where for the measurements “Measuring MISRA compliance”, “Measuring MAAB compliance” and “Measuring TargetLink Known problems compliance”, three quality measures based on the same measurement function are computed, see Figure 6.2.
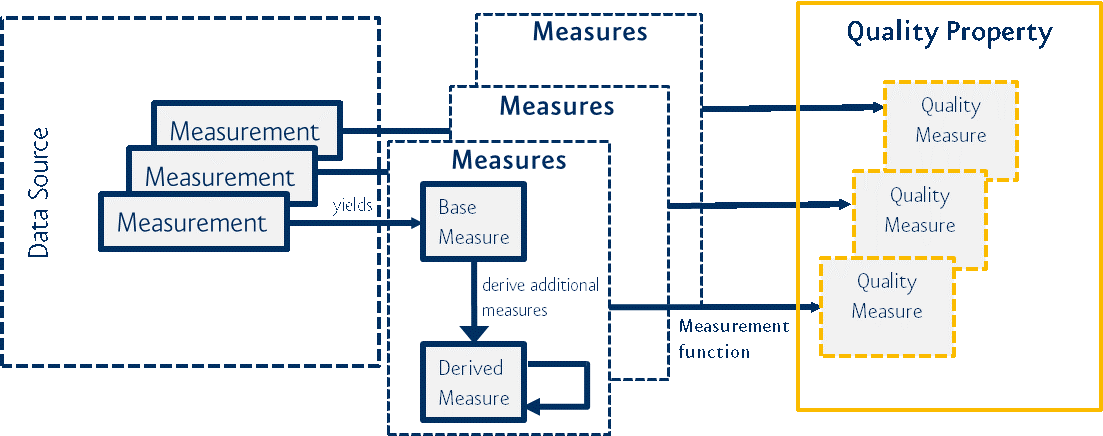
Figure 6.2 Measurements from the same data source use the same measurement function for computing the quality measures
An example for a simple measurement function is the computation of a quality
measure value for the quality property “Model Decision Coverage” using the base
measure values Reached and Total:
[Model Decision Coverage.Reached] / [Model Decision Coverage.Total]
A more complex measurement function calculates the “Local Complexity” using the
three different base measure variables Good, Acceptable and Bad:
1.0*[Local Complexity.Good] + 0.8*[Local Complexity.Acceptable] + 0.2*[Local Complexity.Bad] / [Local Complexity.Good] + [Local Complexity.Acceptable] + [Local Complexity.Bad]
The given base measures are weighted accordingly to compute a normalized quality value, i.e. between 0 and 1.
Please refer to Quality Properties for details on how to configure quality properties and measurement functions in MQC.
6.2. Quality Bins
Quality measures can be mapped to quality bins. A quality bin then contains a set of quality measures of a certain value range. The value ranges of the quality bins can be adjusted. Currently MQC uses a quality bin definition as follows:
Bad, for quality measures in [0%, 20%]
Acceptable, for quality measures in [20%, 80%]
Good, for quality measures in [80%, 100%].
Next to the quality measure, the quality bin adds an additional attribute to each quality property (see Figure 6.3).
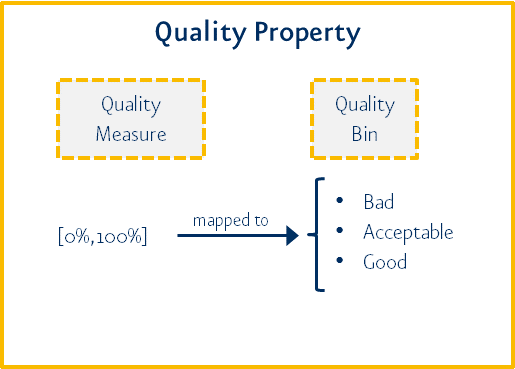
Figure 6.3 Quality bin as additional attribute in quality property
By counting the number of elements in the bin categories “Good”, “Acceptable” and “Bad”, MQC is able to provide a quality value distribution.
6.3. Quality Model Structure
Quality properties are the computable atomic elements of the quality model with values between 0 and 1. By an adjustable aggregation method, an overall quality value is derived.
MQC allows the user to implement a general quality model that complies with ISO 25010. The user can define quality properties, sub-characteristics and characteristics according to the project and process needs. Figure 6.4 shows this general hierarchy of the quality model.
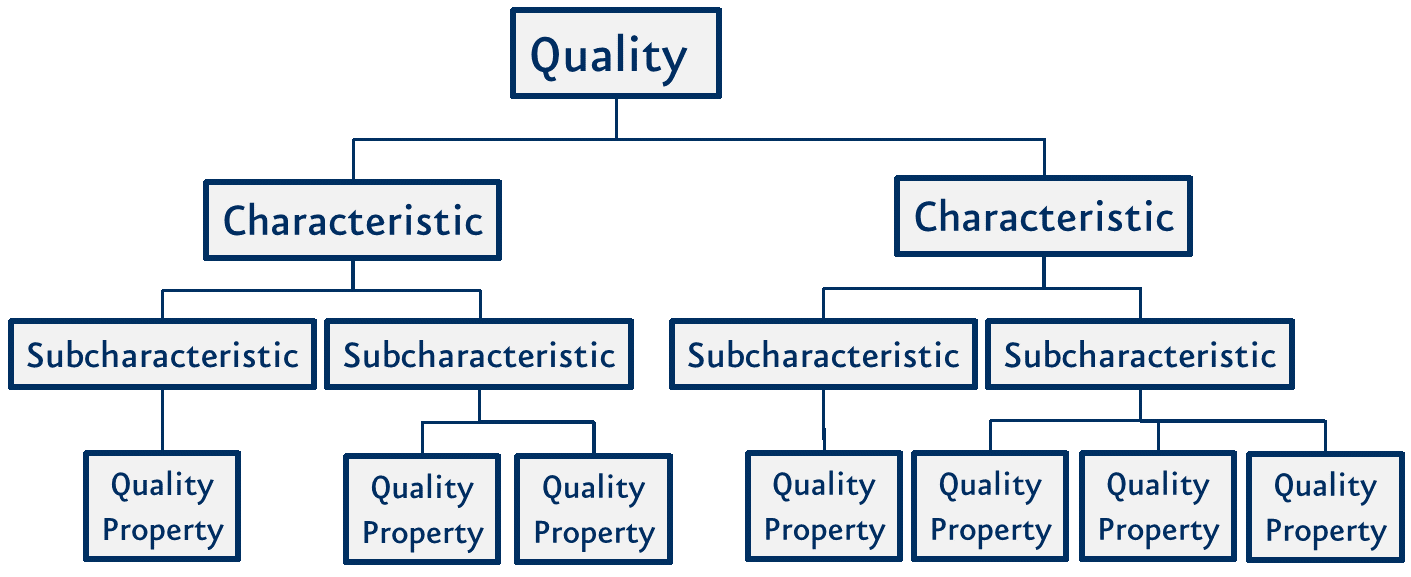
Figure 6.4 Quality Model – Concept (ISO 25010, p. 2)
In the following Quality Aggregation it is explained, how quality is aggregated on the different levels.
6.4. Quality Aggregation
In Quality Computation, we explained how the quality properties are computed for one artifact in a certain revision. Quality properties are represented by quality measures with a value between 0 and 1. Therefore, based on the imported data, quality values between 0% and 100% are computed.
Looking at the three dimensions ‘Measure’, ‘Artifact’ and ‘Revision’ all the quality measures build a quality cube, see Figure 6.5. Each quality property represents a slice (please note that several measurements yield several quality cubes).
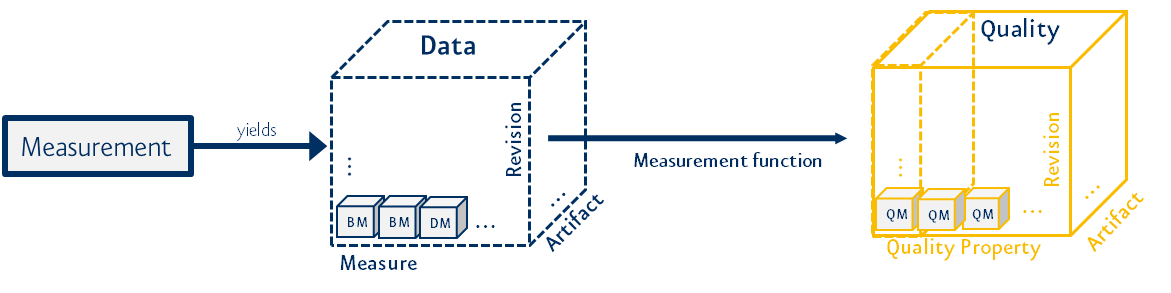
Figure 6.5 From data cube to quality cube
Based on the quality measure for each quality property per revision and artifact, a first aggregation step is performed. For every single quality property, the corresponding quality measures for all artifacts are aggregated by calculating the average (see Figure 6.6).
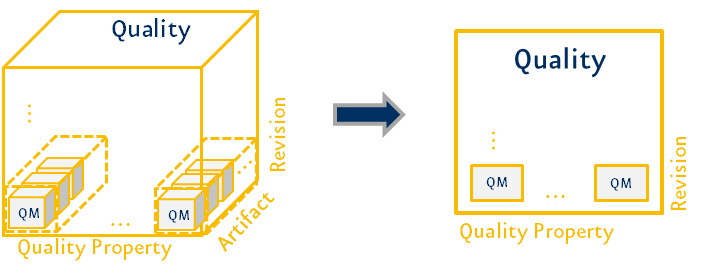
Figure 6.6 First aggregation step with respect to all artifacts
This is the basis for further quality aggregation into sub-characteristics and characteristics.
According to the Quality Model defined by the user, quality property measures (previously aggregated over all artifacts) are aggregated to quality sub-characteristic. These once again are aggregated, this time to quality characteristics. A final step then combines all characteristics to a final quality value for each revision, see Figure 6.7. All aggregations use the average calculation as aggregation function, e.g. the average of all quality property measures for a certain sub-characteristic is calculated to gain the quality measure value for this particular sub-characteristic and so forth.
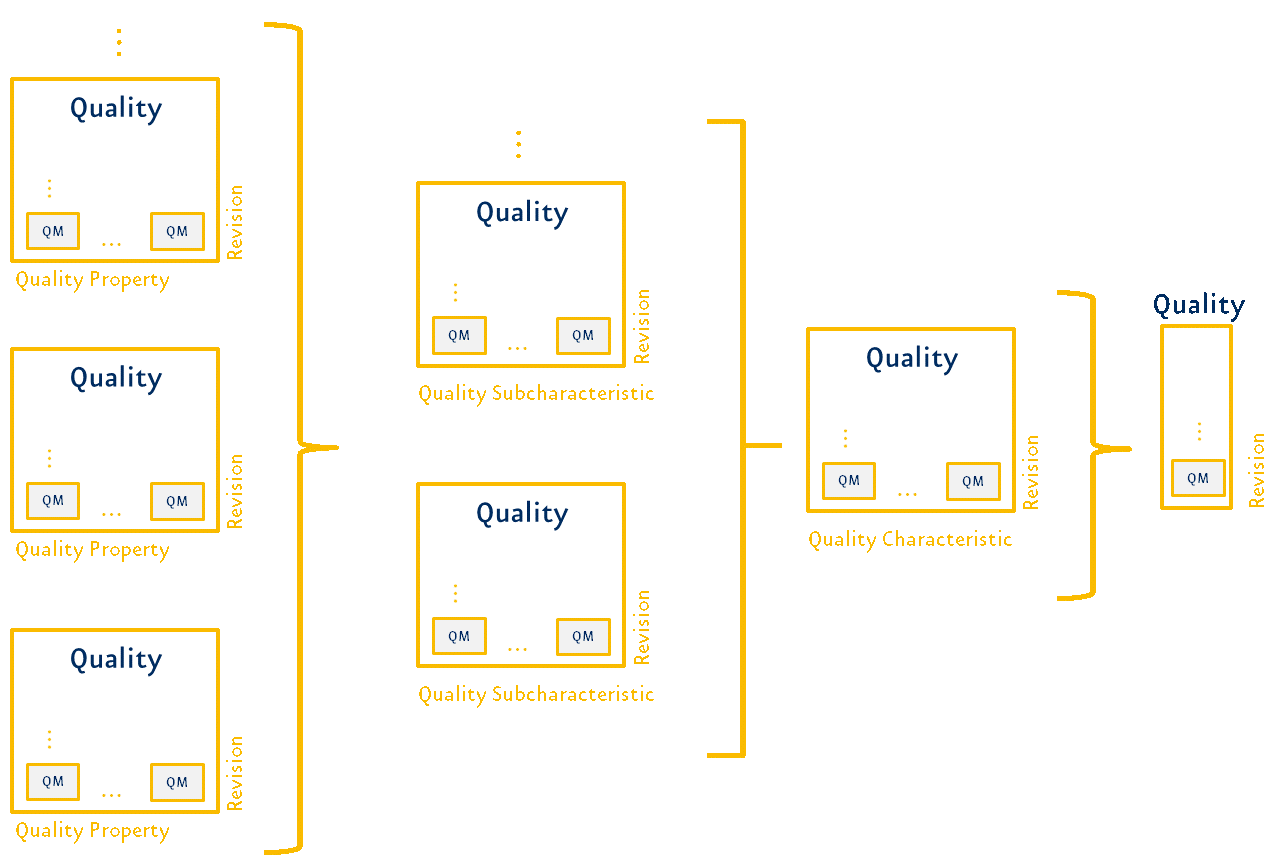
Figure 6.7 Quality aggregation that results in a final quality value for a revision
Note
How quality properties are structured affects the overall quality. Aggregation is performed with respect to the structure: The quality of a higher characteristic is based on the aggregation of the previous sub-characteristics or quality properties.