17. Data Details
In MQC there are three ways to retrieve detailed information from the imported data:
Data Details Drill Down from quality measures to the underlying data that was used to compute the quality,
Tool Pages to get detailed information on tool specific data,
Custom Pages to create project-specific pages for selected measures (quality as well as data) including targets.
17.1. Data Details Drill Down
The data details drill down functionality provided by MQC is the easiest way to track the underlying data, which was used to calculate a certain quality measure value as shown on the MQC Quality pages.
The drill down works by selecting the data of interest by either marking in the charts on a Quality page or by using the “Data of the Quality” / “Filter by Quality” dialog in the left menu.
When on a Quality page clicking inside a chart results in a marking, which is then used to reduce the shown quality in other charts depending on the selection.
For the underlying data of quality, mark either
an arbitrary number of Quality Properties
an arbitrary number of Quality Bins in the Quality Bin Distribution chart
an arbitrary number of quality tiles within the QualityMatrix visualization on the Quality Status page or within the Quality Status on the Quality Sunburst page
Note
The way how data is selected (KPIs or tiles) defines the data that is shown at the Data pages, see Data Selection for Drill Down.
After selecting the quality measures of interest, the menu item “Data of the Quality” in the left menu get’s prepended with a grey link button.
Figure 17.1 “Data of the Quality” in left menu, when something is marked
By clicking on the grey link button opens the corresponding data page to the currently open quality page (e.g. Data Status for Quality Status) and reduces the metrics shown in the main visualizations to those used to calculate the selected quality measures.
Clicking on the menu item “Data of the Quality” itself opens the “Data underlying the Quality” dialog, where the current marking is applied to the presented checkboxes. Here the selection can be changed indepentant from the marking and afterwards applied for the data drill down with “Filter data”
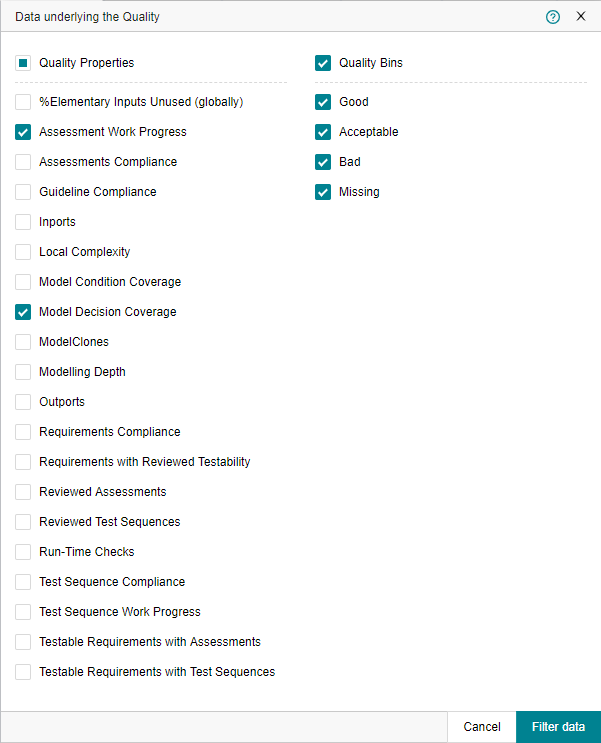
Figure 17.2 “Data underlying the Quality” dialog with only some Quality Properties and all Quality Bins checked
17.1.1. Data Selection for Drill Down
Quality Bin Distribution
If one or more Quality Measure Bins are selected, MQC shows the data, which resulted in the selected quality bins.
Quality Properties
If one or more Quality Properties are selected, MQC shows the data, which was used to calculate the selected quality properties.
Quality Tile Selection
Each quality tile inside the Quality Matrix on the Quality Status page shows the quality measure for a particular quality property for a particular artifact.
The markable parts of the Quality Status on the Quality Sunburst page show Quality Properties and grouped Characteristics.
If one or multiple tiles are selected, MQC only shows the data, which was used to calculate exactly the selected quality property for the selected artifact.
17.1.2. Drill down to Data Trend
To drill down to data trend, move to the Quality Trend page, and select the data of interest, e.g. all acceptable (yellow) and bad (red) quality bins from the Quality Bin Distribution chart at the top of the page.
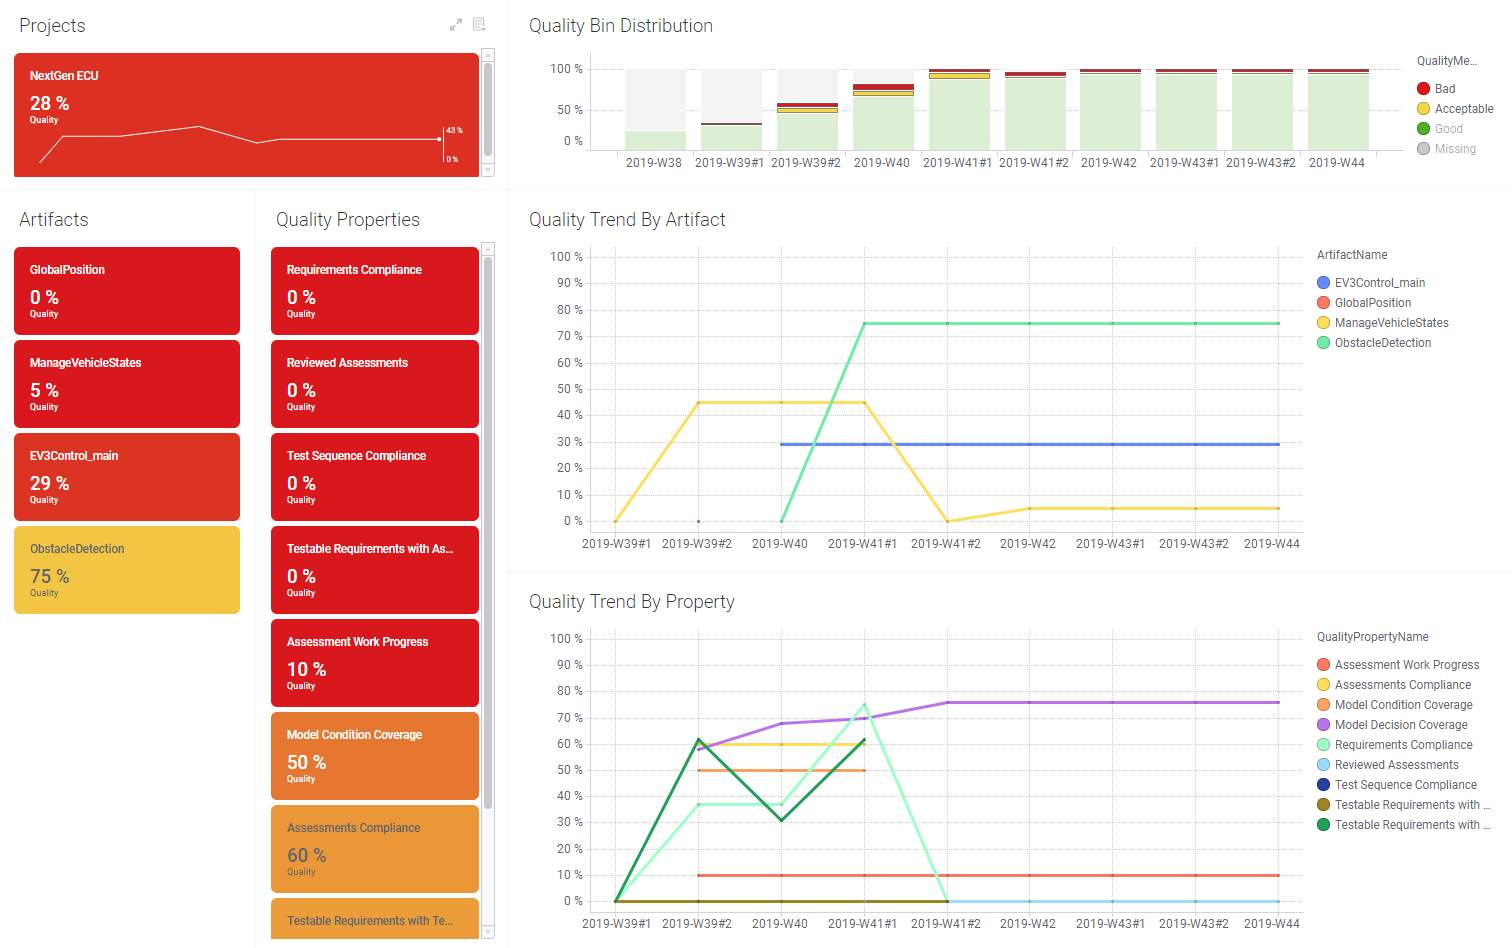
Figure 17.3 MQC Quality Trend page after marking acceptable and bad quality bins to reduce the main visualization to quality properties of interest
The other visualizations immediately reduces the shown quality properties to those with an acceptable or insufficient quality per artifact. By hovering over the tiles the concrete quality value is shown.
Now click on the grey button next to “Data of the Quality” in the left menu.
MQC directly switches to the Data Trend page and reduces the visualization to the measures that were used to calculate the selected quality (see Figure 17.4).
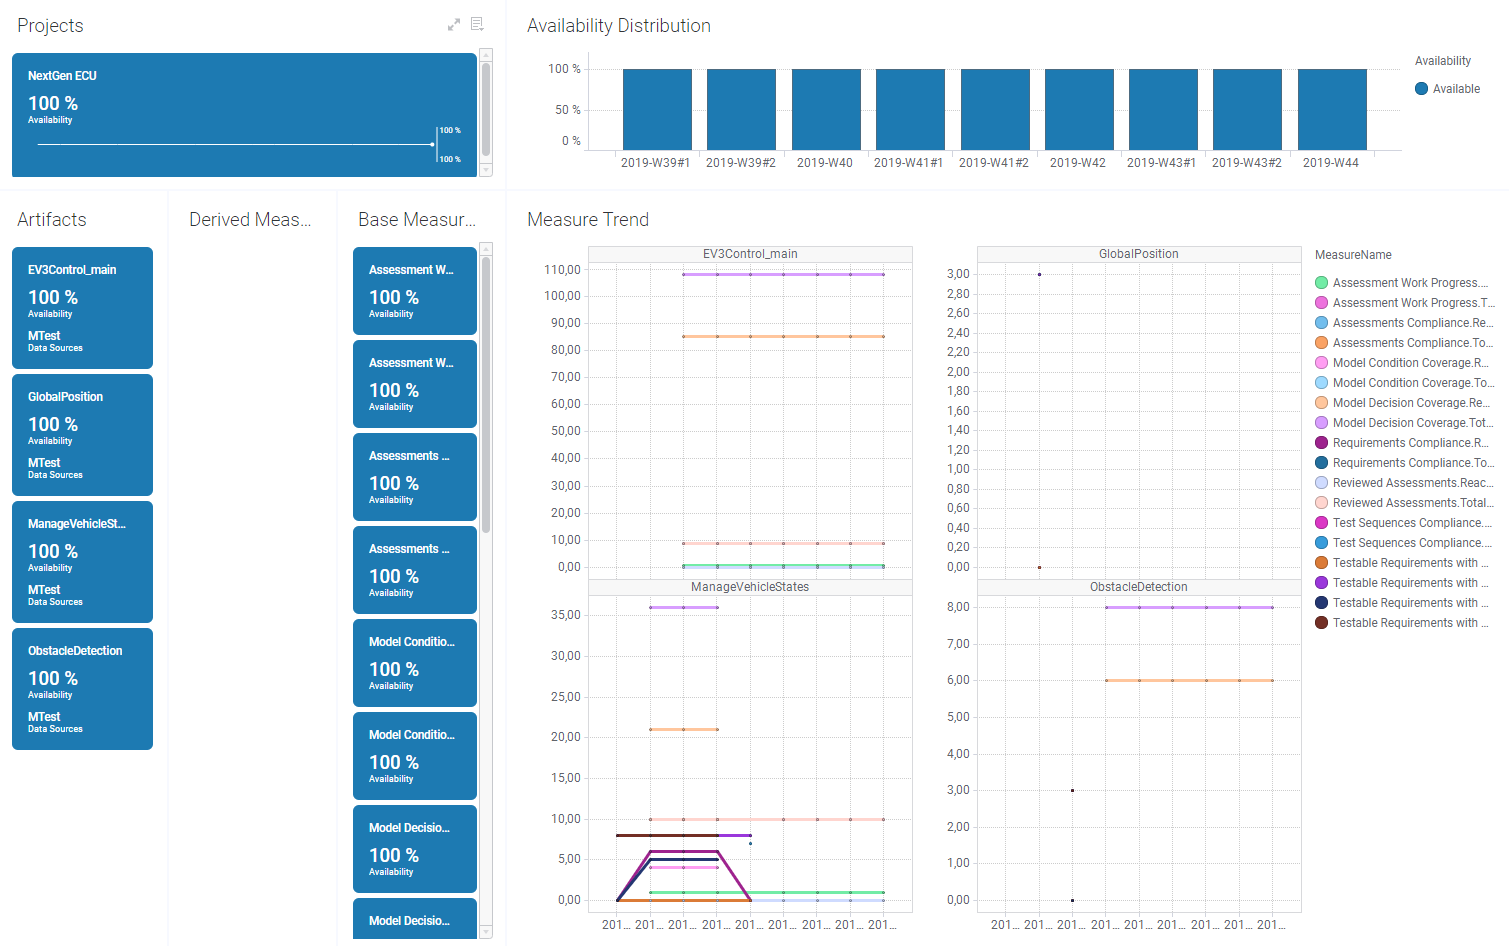
Figure 17.4 MQC Data Details on Data Trend showing underlying data
17.1.3. Drill down to Data Status
Instead of drilling down to data trend, MQC also supports to drill down to data status.
Switch to a Quality Status page (Quality Status, Quality Sunburst or Quality Heatmap), and select multiple artifacts as well as multiple quality properties.
The main visualization are limited based on your selection, so, the Quality Matrix visualization just shows qualities for selected artifacts and selected quality properties.
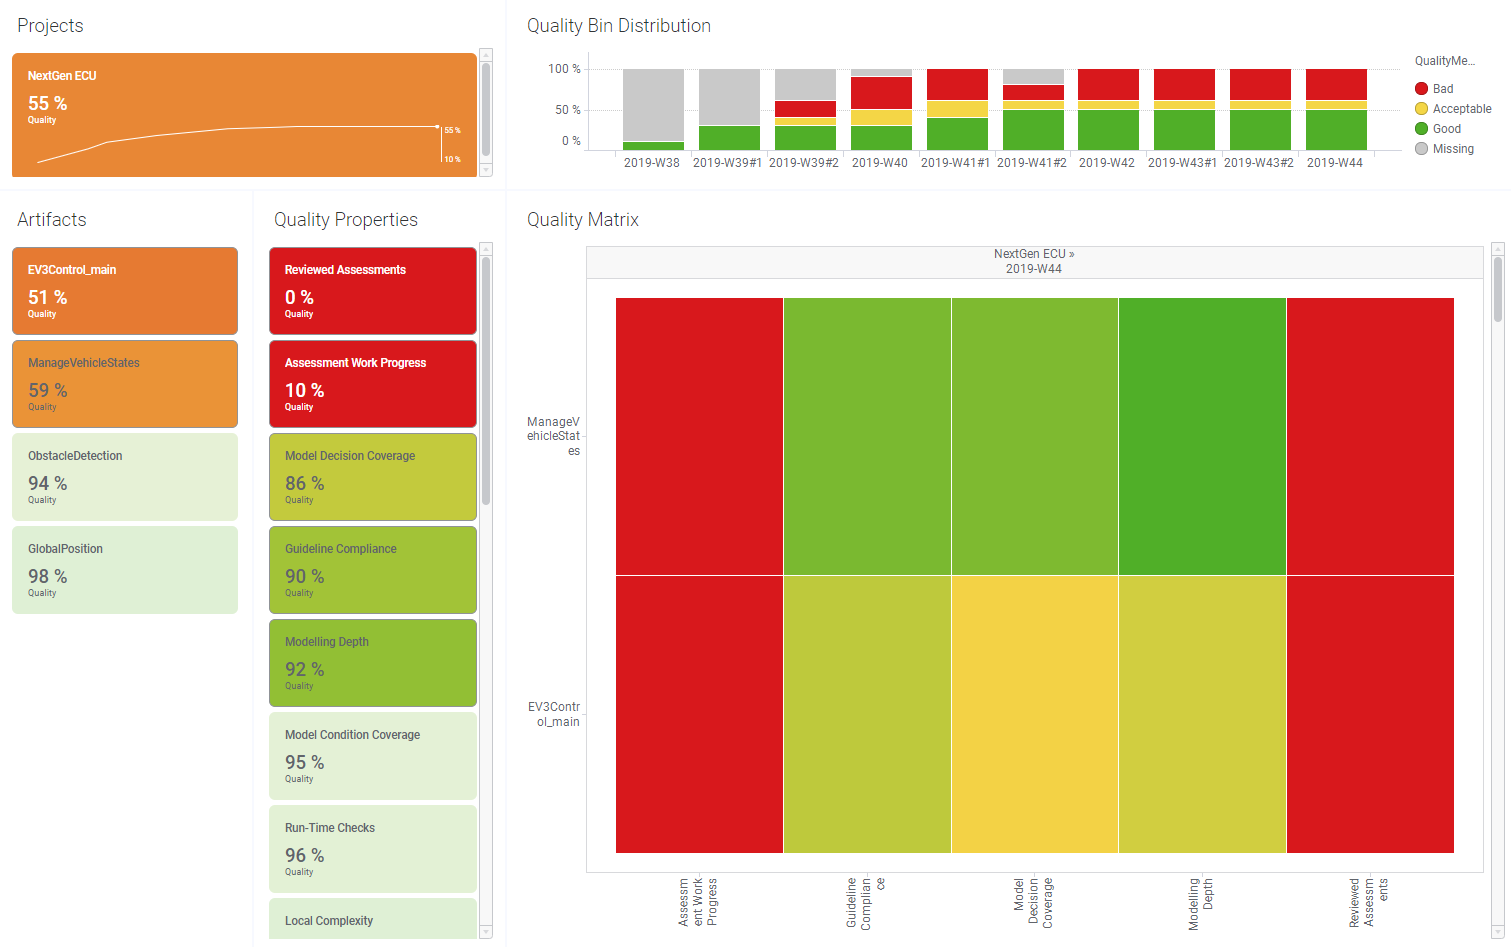
Figure 17.5 MQC Quality Status page just showing selected Artifacts and Quality Properties
Now click on the grey button next to “Data of the Quality” in the left menu.
MQC directly switches to the Data Status page and reduces the visualization to those base and derived measures that were used to calculate each combination of the selected artifacts and quality properties (see Figure 17.6).
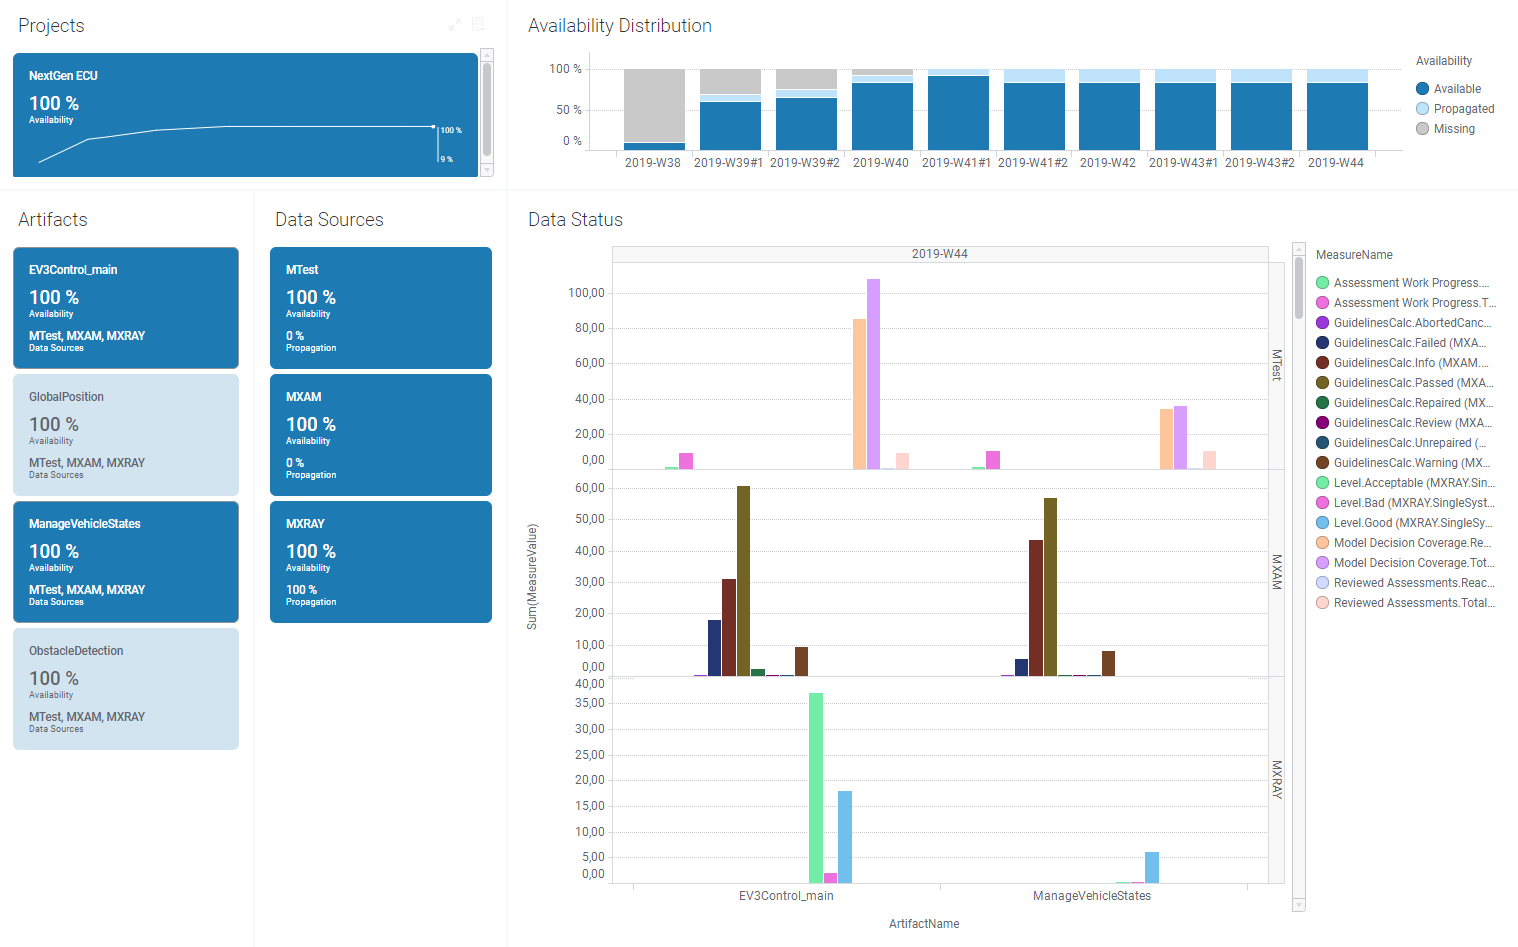
Figure 17.6 MQC Data Details on Data Status showing underlying data
17.2. Tool Pages
A second way to look at the imported data is by using preconfigured tool pages. MQC provides the possibility to add specific tool pages for many of the supported data source adapters on demand.
17.2.1. MXAM Details Page
The MXAM Details page can be added via checked MXAM under the Tool Pages
title in dialog from the Configuration section of the menu or by
.
The MXAM page focuses on MXAM findings per artifact, additionally showing number and type of severe issues to be solved first.
For more details, please refer to Section MXAM Tool Page.
17.2.2. MTest Details Page
The MTest Details page can be added via checked MTest under the
Tool Pages title in dialog of the Configuration
panel or by .
It provides a comparision of expected versus reached test metrics in trend and in status, which is structured based on:
Requirements
Test Sequences
Assessments
Coverage
For more details, please refer to Section MTest Tool Page.
17.2.3. M-XRAY Details Page
The M-XRAY Details page can be added via checked MXRAY under the
Tool Pages title in dialog of the Configuration
panel or by .
The M-XRAY page focuses on M-XRAY results per artifact, e.g. how many subsystems per artifact with good, acceptable or bad local complexity, additionally showing number and type of severe issues to be solved first.
For more details, please refer to Section MES Test Manager® (MTest).
17.3. Custom Pages
A third way to look at the data in a detailed way is to create an arbitrary number of additional pages containing user-defined trend and status charts for selected measures, i.e. base measures, derived measures, as well as quality properties.
The way how to structure and to visualize the imported data to be analyzed in that way, is described in the Custom Pages chapter.