5. Dimensions and Structures
The aim of MQC is to compute quality for a project based on provided data and to visualize this data in a structured way. In order to do this, MQC structures the provided data systematically. This is done with the help of artifacts, projects, revisions, and milestones.
Based on this structuring, MQC can offer several views on the provided data as well as the derived quality. MQC follows the terminology of ISO 25010, ISO 25012, and ISO 25022 when structuring the provided data and the computed quality. This chapter gives an overview of the terms used in MQC and their relation to ISO 25010, ISO 25012, and ISO 25022.
5.1. Artifacts and Artifact Structure
When data is collected within MQC, it is linked to objects for which that data was measured and which should be used for visualization and quality computation. Artifacts in MQC are any objects for which quantitative data is collected. Examples of artifacts are Simulink models, generated code or documents like review protocols. Figure 5.1 shows examples of artifacts. The Simulink model, the requirements document, the respective TargetLink model, and the generated code all represent artifacts.
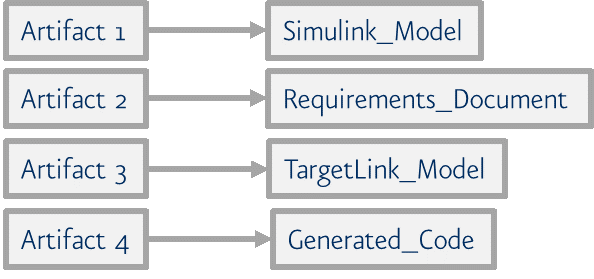
Figure 5.1 Example of artifacts in MQC
However, artifacts can also be defined in a more general sense. They do not always need to represent real objects as work products. Artifacts can also represent virtual objects like process steps, for example.
Artifacts can be grouped hierarchically. This structure can represent a state of the artifact itself, but it can also represent a logical structure. For instance, Simulink models can be grouped based on their functionality. However, a Simulink model can also be grouped with respect to different responsibilities (e.g. model 1 and 2 are grouped by role 1). As an example, consider several Simulink and TargetLink models that are grouped according to their implementation. See Figure 5.2 for an example of the general artifact grouping in MQC.
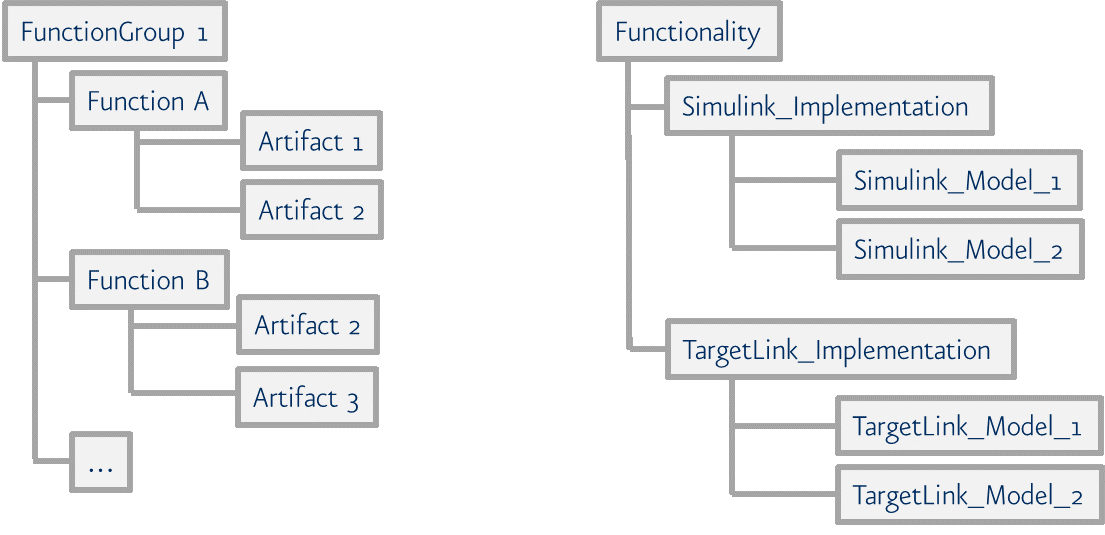
Figure 5.2 Artifact grouping in MQC
For details about how artifacts can be grouped in MQC, please refer to Artifact Structure.
5.2. Revisions
In real-world projects, data is collected for artifacts at different points in time. When data is imported into MQC, it is assigned to revisions. Assigning the data to revisions depends on the time stamp that is provided by the data source. If there are multiple instances of data available for the same revision, usually the latest data instance is used and visualized in MQC. As an example, consider a weekly revision granularity and several reports with data created on different days of a week. Then, the one with the latest time stamp is used for the weekly revision, see Figure 5.3
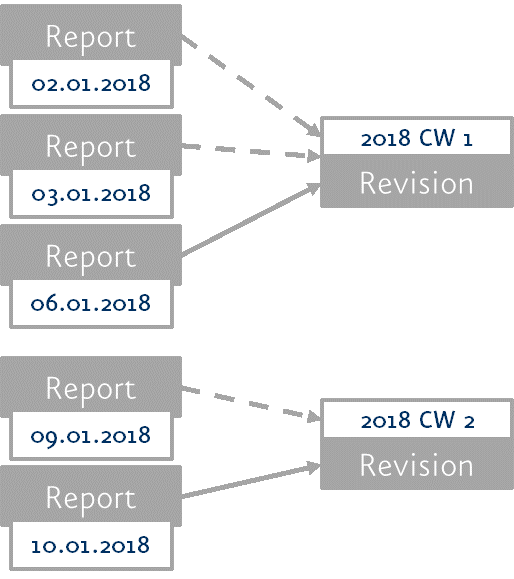
Figure 5.3 Assigning data to revisions
MQC currently supports three types of revision granularities: daily, weekly and monthly .
5.3. Projects and Milestones
In MQC, projects can be defined in order to represent real world development projects. The artifacts with the given data will be linked to these projects. Typically, one or multiple artifacts belong to a certain project. Nevertheless, please note that one artifact can be linked to several projects, too. However, the artifact structure as described in Artifacts and Artifact Structure is always defined for an artifact which is independent of a certain project. The relationship between artifacts and projects and the artifact structure is shown in Figure 5.4.
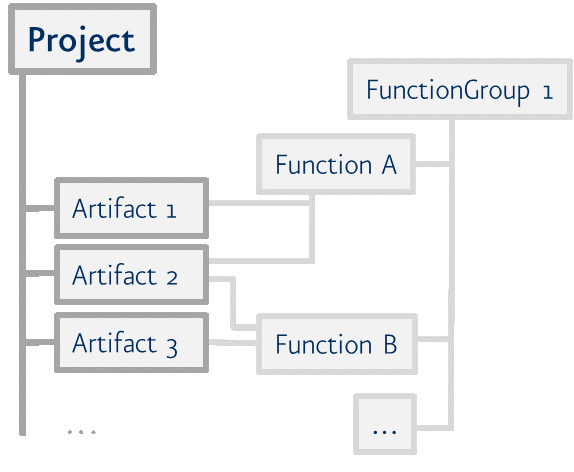
Figure 5.4 Relationship between artifacts and projects
Defining relations between your artifacts and certain data sources, measurements, measures or even variables can be helpful to configure your project properly. You can assign data sources, measurements or measures to certain artifacts, defining the exact data that is expected (“whitelisted”) or excluded (“blacklisted”) for these artifacts within your project. You can define that association between Data Sources and Artifacts via Context Categories. The following figure shows the relationship between artifacts and data sources (including measurements and measures).
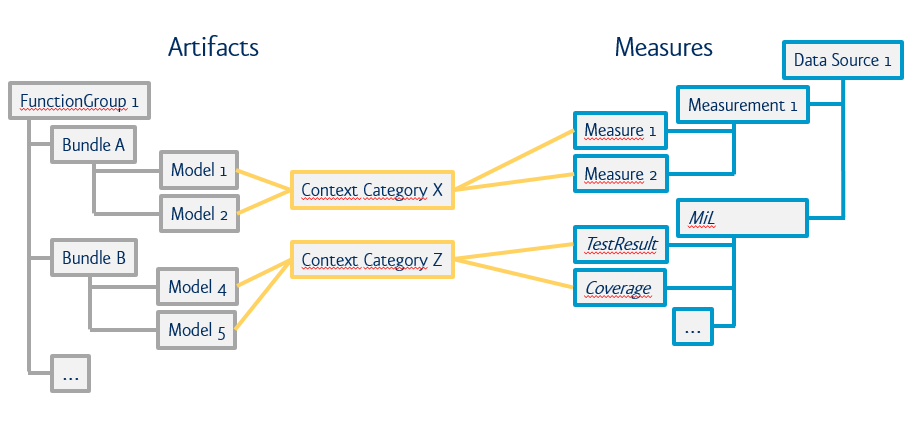
Figure 5.5 Relationship between artifacts and data sources
For more information concerning the usage of Context Categories for your project, please refer to the section with the same name (see Context Categories).
Each project can define its own milestones, where a milestone represents an important development step, i.e. the milestone time defines the end of a respective period, which starts at the end of the previous milestone and lasts until the current milestone time.
In MQC, this is realized by clustering revisions and linking the clustered revisions to a milestone defined for a certain project according to a common timeline. This means all revisions with a start time after the previous milestone and before the current milestone are linked to the current milestone. With that, data assigned to a revision is also linked to the milestone, to which the revision belongs.
The relationship between projects, revisions and milestones is depicted in Figure 5.6.
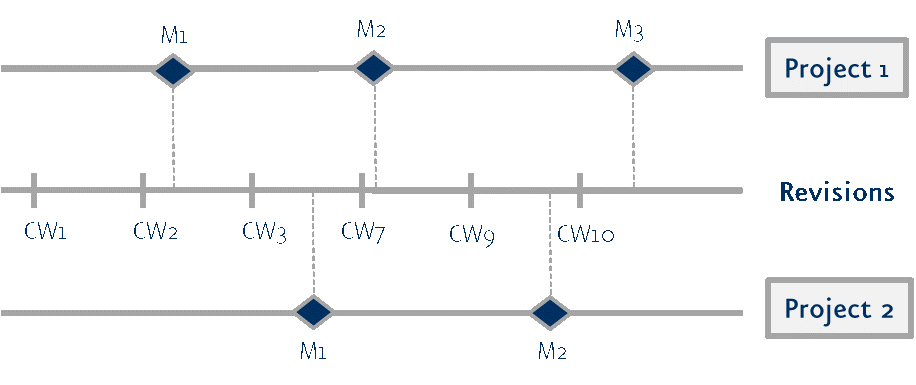
Figure 5.6 Relationship between projects, their milestones and revisions
For details on how to define projects and their milestones in MQC, please refer to Project Naming and Project Milestone Structure, respectively.
5.4. Measures and Measurements
Data is collected from a source via measurements. A measurement yields one or multiple measures. This is done for an artifact at a specific point in time (by a revision). Figure 5.7 shows this workflow, i.e. the measurement yields data represented by the three dimensions Measure, Artifact and Revision.
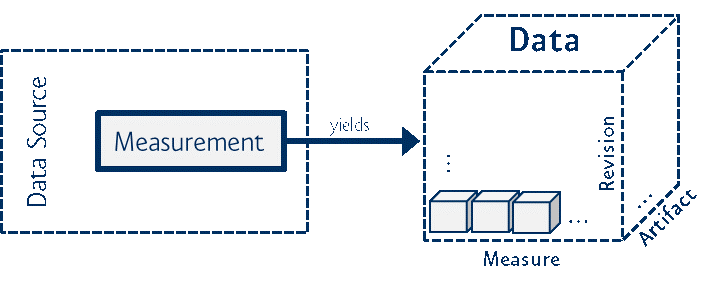
Figure 5.7 From measurement to data
In the following, only one artifact for a fixed revision is considered so that the dimensions of the data cube are reduced to one, see Figure 5.8.
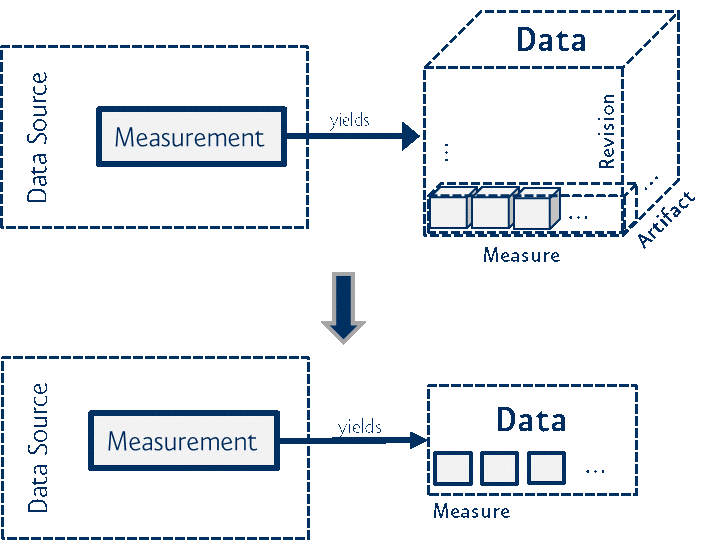
Figure 5.8 Freeze artifact and revision dimension
The measurement is the process, by which data is collected and by which the values of one or multiple measures are determined. Therefore, a measure is a variable to which a value is assigned by the execution of a measurement (see Figure 5.9).
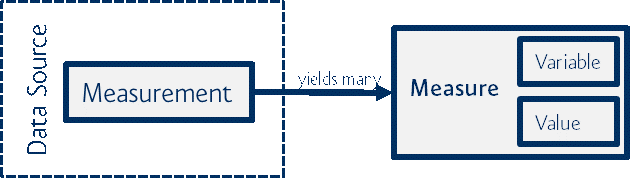
Figure 5.9 Measurement yields measures
An example is the measurement “Measuring MISRA compliance” for model A and revision X, which results in a guideline report with, for example, the measure variable Passed and the measure value 10.
MQC often imports data from tools directly. The source of the data is named data source. For example, the tools MXAM, M-XRAY or MTEST can be data sources.
A measure that originates directly from a data source is called Base Measure.
Please note that there is no one-to-one relation between measurement and data source. Rather it could be that multiple measurements are relevant for the same data source. For example, when using MXAM as a data source, the measurements “Measuring MISRA compliance”, “Measuring MAAB compliance” and “Measuring TargetLink Known problems compliance” might be considered. Each of these measurements corresponds to one guideline document, for which compliance is checked, and results in one or multiple measures, where each measure consists of a measure variable and a measure value. For example a measure variable Passed may not only exist for the measurement “Measuring MISRA compliance”, it might also exist for “Measuring MAAB compliance” and “Measuring TargetLink Known problems compliance”. See Figure 5.10 for the relationship between data source, measurements and base measures.
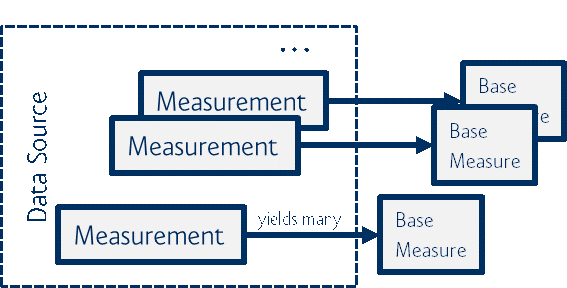
Figure 5.10 Data Sources, measurements and base measures
In MQC, measures can be grouped by type. As an example, consider the
measurement “Measuring Local Complexity” for the data source M-XRAY. This
measurement yields the base measures Local Complexity Good, Local
Complexity Acceptable and Local Complexity Bad. These base measures can
be grouped into a base measure called Local Complexity, which then contains
three elements, each of the elements consisting of a measure variable (i.e.
Good, Acceptable and Bad) and a corresponding measure value.
To address the elements of a base measure group, the notation BaseMeasure.BaseMeasureElement is used.
5.5. Derived Measures
MQC differentiates between base measures (see Measures and Measurements) and derived measures. Derived measures are computed either from base measures or from other derived measures (see Figure 5.11). They are used to visualize their trend and/or to simplify the quality computation.
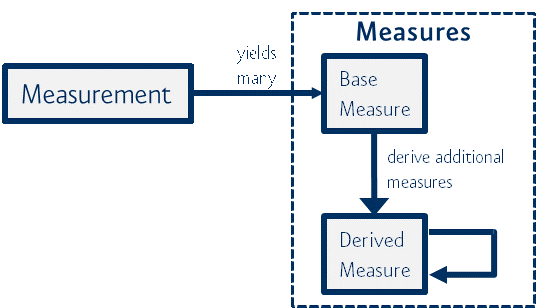
Figure 5.11 Relationship between measurements, base measures and derived measures
As an example, consider the measurement “Measuring MISRA compliance” with the
base measure variables Passed, Failed and Warning. Here, a suitable
derived measure variable Total could be added, which stands for the total
number of all Passed, Failed and Warning guidelines (see
Table 5.1):
Total = Passed + Failed + Warning
Measurement |
Base Measure |
Derived Measure |
||
|---|---|---|---|---|
Passed |
Failed |
Warning |
Total = Passed + Failed + Warning |
|
Measuring MISRA Compliance |
10 |
5 |
5 |
20 |
The function for the derived measures can be used for multiple measurements as long as they have the same base measures. For the above example, this means the derived measure Total can also be computed for the measurements “Measuring MAAB compliance” and “Measuring TargetLink Known problems compliance”.
For details how derived measures are defined in MQC, please refer to Derived Measures.