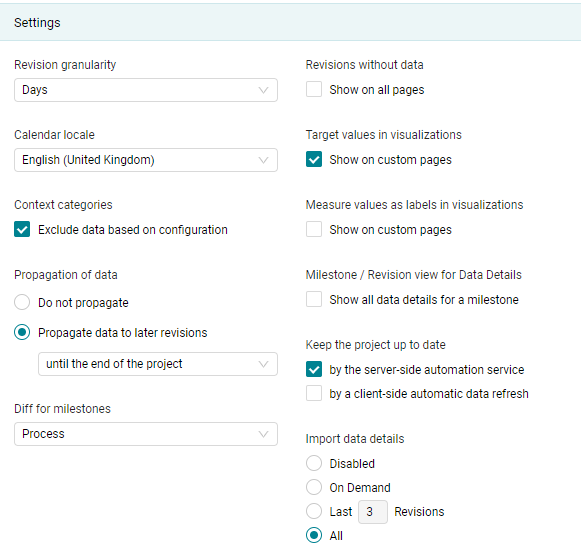
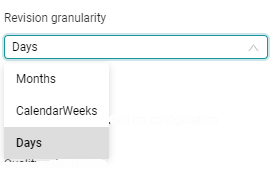
This setting defines the degree of compactions of the revisions for which data exists to better visualize your
trend visualizations. The revision granularity can be selected depending on your needs.
Figure 4.32 The default revision granularity is Days, but it might be useful
to change it to CalendarWeeks or Months
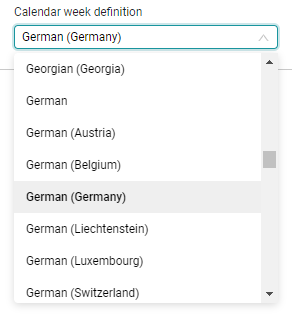
If an MQC project is shared between areas with different locales,
the calendar locale, which was initially determined during the creation
of the project, is kept. This allows a consistent view on data and quality.
Per default the usage of Context Categories is disabled, hence, all data is
expected and shown for all artifacts. To apply the context category configuration,
enable this setting.
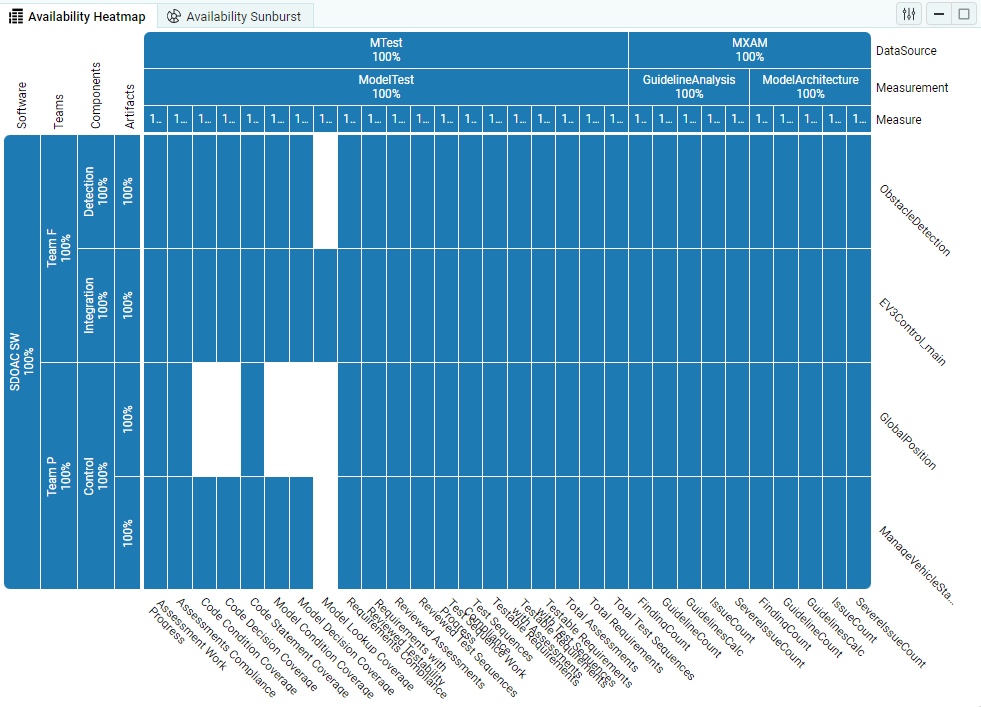
With context categories enabled, for each artifact only expected data is shown
in all visualizations (see Figure 4.34).
All other data is excluded (white areas of the matrix). By this, you can easily
distinguish between not expected data and data that is really missing.
(see context categories in Artifacts)
Figure 4.34 Availability Heatmap showing expected data (Context Categories enabled).
Additionally, only expected data is used for calculating quality for an artifact.
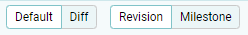
The Diff View (see diff-mode) shows the differences between revisions.
By selecting a milestone structure for “Diff for milestones”, an additional comparison
is created that compares each revision to the last milestone of this structure.
The Diff base can be switched in the toolbar between the Revision and Milestone comparisons.
By default MQC hides all empty revisions, for which no data was imported.
This setting allows you to display these configured but empty revisions
for all artifacts and measures within this project.
4.4.7. Target values in visualizations (Custom pages)
To make imported Target Values visible in the corresponding visualizations
on custom pages (see Custom Pages), enable this setting.
Targets per measure are shown as:
separate dashed lines with the same color in trend visualizations
horizontal lines in status (bar) visualizations
Figure 4.36 Trend visualization showing a quality property with a corresponding target value
Figure 4.37 Status visualization showing measures with a corresponding target values
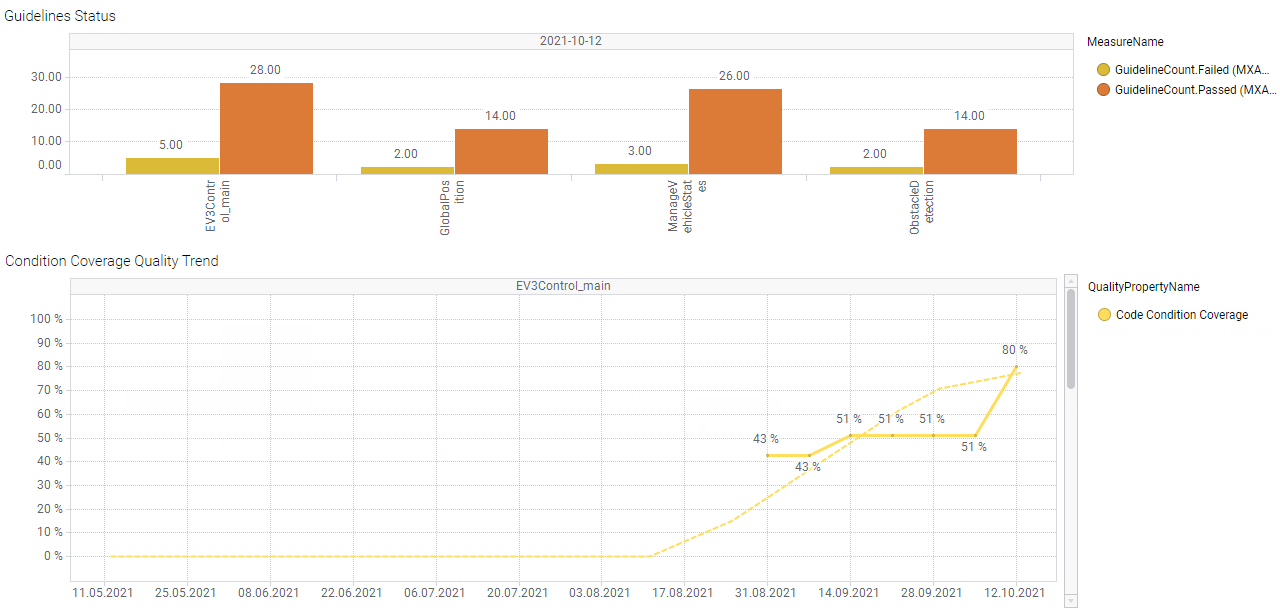
4.4.8. Measure values as labels in visualizations (Custom pages)
Value labels can be made visible for status and trend visualizations
in custom pages. (see Custom Pages)
Figure 4.38 Trend visualization and Status visualization showing value labels
Enabled value labels are also included in the visualizations of a created report.
In a Report value labels provide an alternative to the information that is normally
only available via tooltips.
4.4.9. Milestone / Revision view for Data Details
By checking “Show all data details for a milestone” the revision selection on the
data details page gets replaced with a milestone selection.
The status visualizations show all findings since the last milestone up and including
to the selected milestone.
This setting is useful if the data was configured as incremental and the findings are
therefore also only imported incrementally.
MQC projects with this setting enabled and saved in the server library are
updated periodically to fetch the latest data changes.
Background server-side updates are only executed if new or changed data was detected.
This ensures that all relevant projects are always kept up to date.
See Update Projects on Server for details on how to add a job to the
“Automation Services” on the MQC Server to periodically check and update
MQC projects.
by a client-side automatic data refresh
MQC projects open in the desktop client and web player use a background monitoring to detect changes in the data
of the projects.
While this setting is disabled, the user is informed of updates by a change in the
Data Import State. The user can then update the project by clicking on the “Refresh Data” button
provided there.
While this setting is enabled, any change detected in the data results in a directly executed update of the
project in the client, while the user is interrupted in his work and has to wait until the project has been updated.
If Data Details are not disabled, they are imported by the DataSource adapters that can read findings.
(at the moment only the MXAMmxmr Adapter supports reading findings)
Disabled
Data Details are disabled.
The DataSource Adapters do not import findings.
The Data Details page and Data Details visualizations are not available.
On Demand
Data Details will not be imported by default, but can be loaded on demand later.
The Data Details visualizations show ‘Not Loaded’ findings, while the List shows
a warning message, if data details have not been imported.
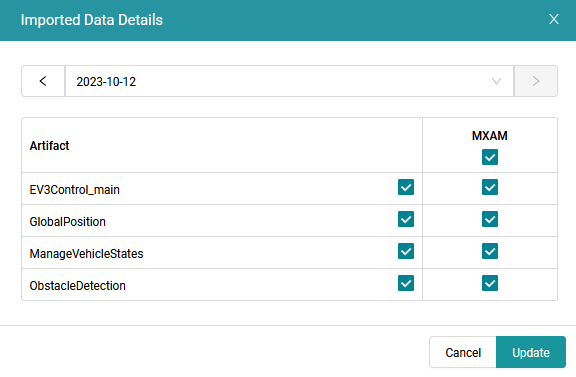
By clicking on the Imported data details button, the data details
to be imported can be configured with the combination of artifacts, datasources
and revisions.