5.2. Quality
This chapter explains how MQC computes quality based on the imported data, derived measures (both are introduced in Dimensions and Structures) and a Quality Model. Additionally, it describes how quality is structured in MQC.
5.2.1. Quality Computation
When data is collected and imported in MQC, it is handled in terms of measures.
A measurement – that is the set of operations executed to determine values for measures – is applied and it yields a collection of measures including their measure values (variables). Either these measures can be base measures coming directly from the data source or derived measures, i.e. computed from base measures or other derived measures (see Figure 5.10).
One, two or multiple of these base and derived measures are used to calculate a quality value. This quality value is associated to a so-called quality property. Quality properties define the lowest level of computed quality. Examples of quality properties are “Guideline Compliance” or “Test Sequence Compliance”.
For each quality property, a measurement function defines how to calculate the quality value by using base and derived measures.
Quality values always need to be between 0 and 1 (means, between 0% and 100%). This is ensured by MQC even if the measurement function yields a value outside these boundaries.
Alternatively, it is possible to define Conditions. Then, the
result of a measurement function is not a numerical value. Instead, data
measures are used to define conditional expressions. As a result, a specific
quality bin (see Bins) is assigned if a condition is
true.
The workflow from measuring the data to calculating the quality value for a quality property is shown in Figure 5.11.
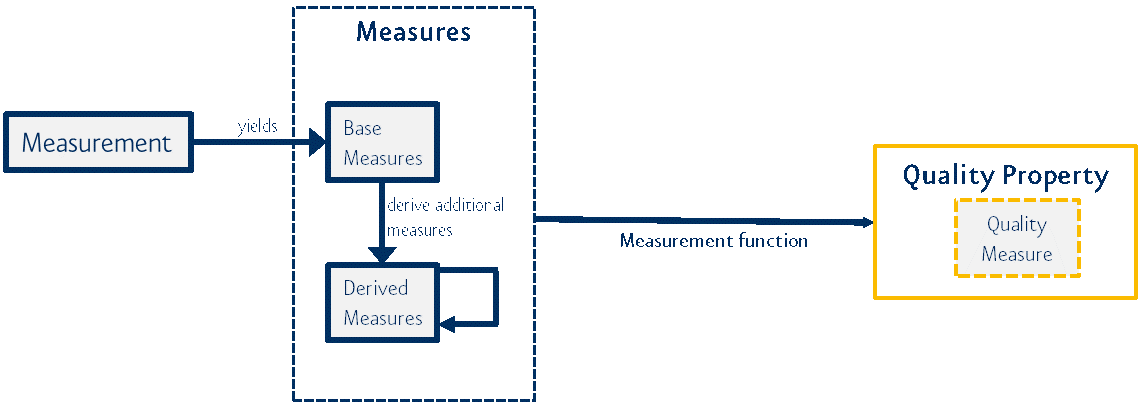
Figure 5.11 Workflow from collecting data with a measurement to calculating a quality value by a measurement function
Each measurement function is executed:
for each artifact
If a project consists of three artifacts, a measurement function to calculate e.g. the Test Sequence Compliance is executed three times based on the corresponding measures imported for each of the three artifacts.
for each revision
Per artifact, quality is re-calculated at fix points in time (revisions) during project runtime, each time using the actual measures imported for that artifact. If a project lasts e.g. for 3 weeks and the revision granularity is weekly, a quality measurement function is executed three times, once per week, for each artifact.
for each measurement
A data source may provide the same data measures from different measurements, e.g. test results may be imported for MiL and for SiL tests. If a measurement function is not explicitely defined for a specific measurement, it is executed for each measurement separately, see Figure 5.12.
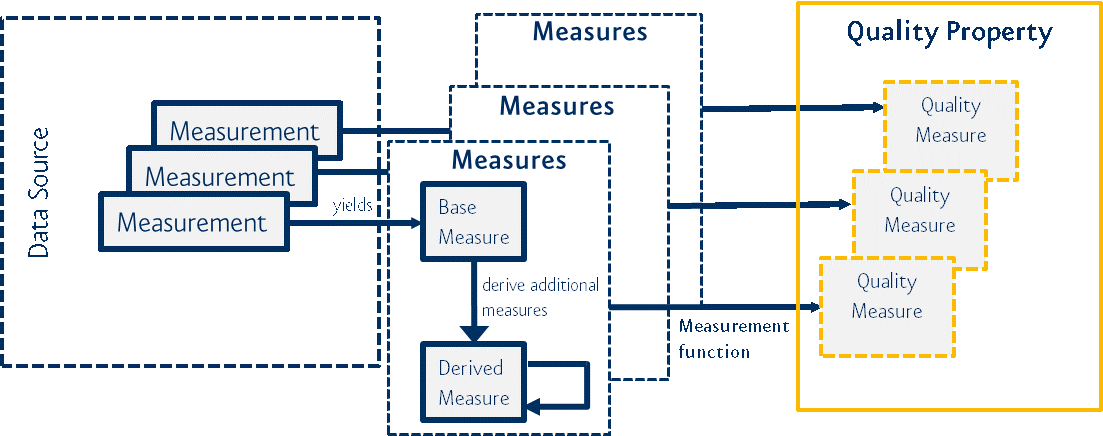
Figure 5.12 Measurements from the same data source use the same measurement function for computing the quality values
Please refer to Quality Properties for details on how to configure quality properties and measurement functions in MQC.
For details about how to define functions and available operators, please refer to Quality Calculation.
5.2.2. Bins
Quality values can be mapped to quality bins. A quality bin is a kind of category that contains a set of quality values of a certain value range. Per default, MQC uses a quality bin definition as follows:
Bad, for quality values in [0%, 20%]
Acceptable, for quality values in ]20%, 80%]
Good, for quality values in ]80%, 100%].
MQC allows to customize these categories. It is possible to configure less or more bins than MQC provides as default, to adapt the value ranges of the bins and even to choose an alternative color scheme. For more details see Quality Bins.
Next to the quality value, the quality bin adds an additional attribute to each quality property (see Figure 5.13).
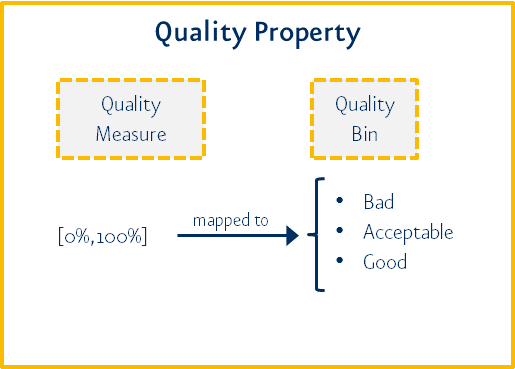
Figure 5.13 Quality bin as additional attribute in quality property
By counting the number of elements in the bin categories, e.g. in the categories “Good”, “Acceptable” and “Bad”, MQC is able to provide a quality value distribution.
5.2.2.1. Conditions
Per default, quality values calculated by a measurement function are mapped to Bins. For example, all values in a range from 80% to 100% may be assigned to the category “Good”, which is indicated by a green color in all quality visualizations.
Alternatively, it is possible to skip the calculation of quality values and directly assign a quality bin if the imported measures fulfill a specific condition.
Such a bin condition could be for example:
in case there are no issues at all -> assign quality bin “Good”
in case the number of issues is higher than 0 but less than 50 -> assign quality bin “Acceptable”
in case the number of issues is higher then 50 -> assign quality bin “Bad”
Please refer to Bin Conditions for details on how to configure quality bin conditions in MQC.
5.2.3. Structure
Quality properties are the computable atomic elements of the quality model with values between 0 and 1. By an adjustable aggregation method, an overall quality value is calculated.
MQC allows the user to implement a general quality model that complies with ISO-25010. The user can define quality properties and a quality structure according to the project and process needs. Figure 5.14 shows an example structure with two levels, “Characteristics” and “Subcharacteristics”, of a quality model.
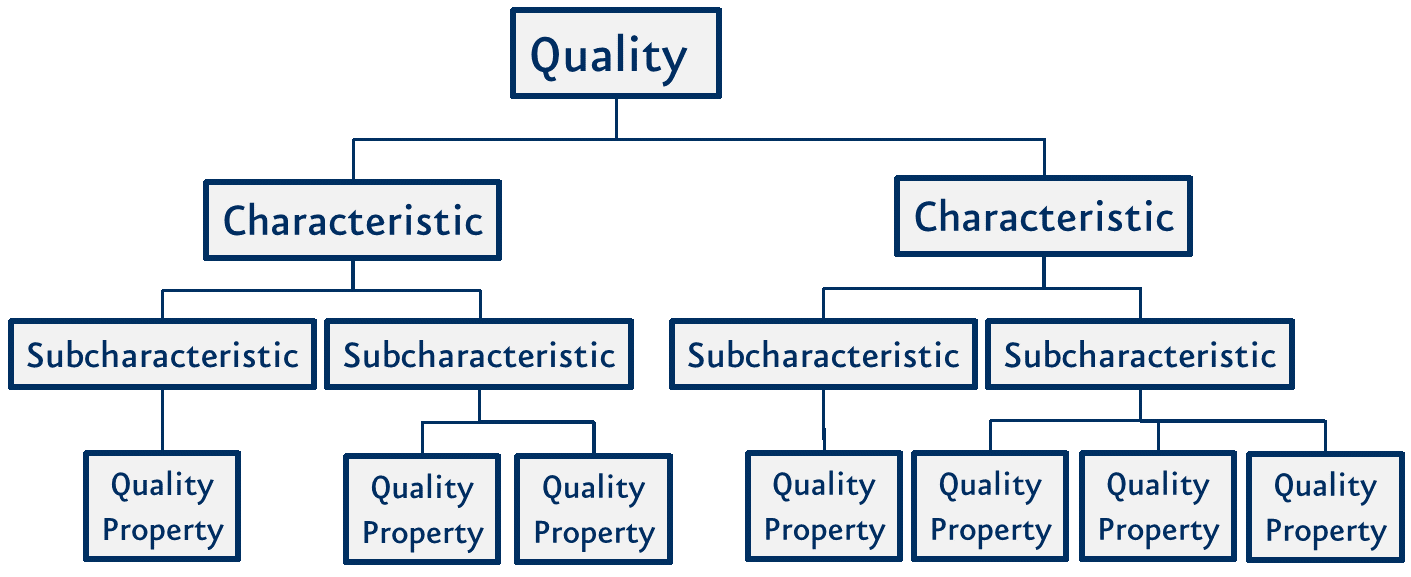
Figure 5.14 Quality Model – Concept (ISO 25010, p. 2)
5.2.4. Aggregation
Looking at the three dimensions ‘Measure’, ‘Artifact’ and ‘Revision’ all the quality values build a quality cube, see Figure 5.15. Each quality property represents a slice.
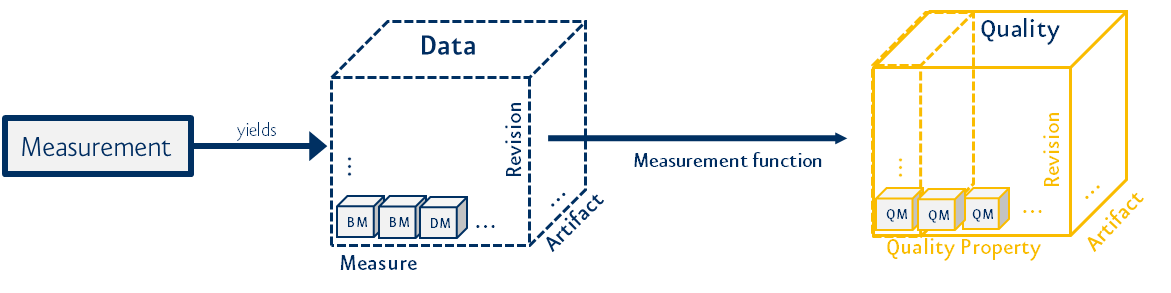
Figure 5.15 From data cube to quality cube
Based on the quality value for each quality property per revision and artifact, a first aggregation step is performed. For every single quality property, the corresponding quality values for all artifacts are aggregated by calculating the average (see Figure 5.16).
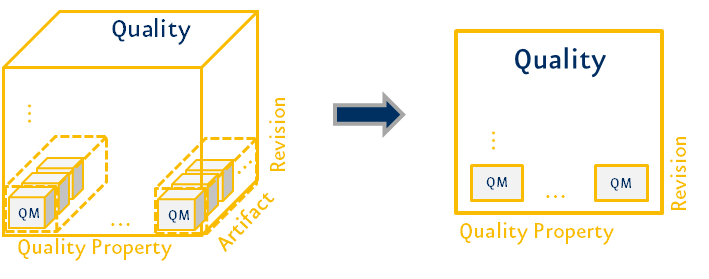
Figure 5.16 First aggregation step with respect to all artifacts
This is the basis for further aggregation in the quality structure.
According to the Quality Model defined by the user, the quality properties are used for the quality aggregation into their parent structure elements and the overall quality. Each of these aggregations is done using the associated quality properties directly as a base. There is no technical hierarchy in the quality aggregation calculation.
All aggregations currently use the (weighted) average calculation as aggregation function, e.g. the average of all quality property measures for a certain structure-element is calculated to gain the quality value for this particular structure-element and so on.
The structure does not influence the overall quality. It can define different structure levels and elements to group and better visualize quality properties, especially for large projects.