23. Status Report
MQC allows the creation of a status report documenting and summarizing the most important data as visualizations (taken from the MQC pages) and tables (focusing either on Artifacts or Quality properties), so that the information is displayed in detailed form.
The report is designed for browsing (HTML) and print (PDF).
To create a new Report, click on the Create button in the Create Report dialog in the menu on the left-hand side.
Note
It is important to know that the active settings from the filter panel are applied for the creation of the report, opening up a more in depth customization of the displayed data.
Active markings, in contrast to filters, are not applied in the creation of the report.
23.1. Configuration of the Status Report
The report configuration dialog allows an extensive configuration of the contents contained in the report. On one side the artifacts contained in the report can be selected by different criteria. On the other side the amount of information for these artifacts may be limited.
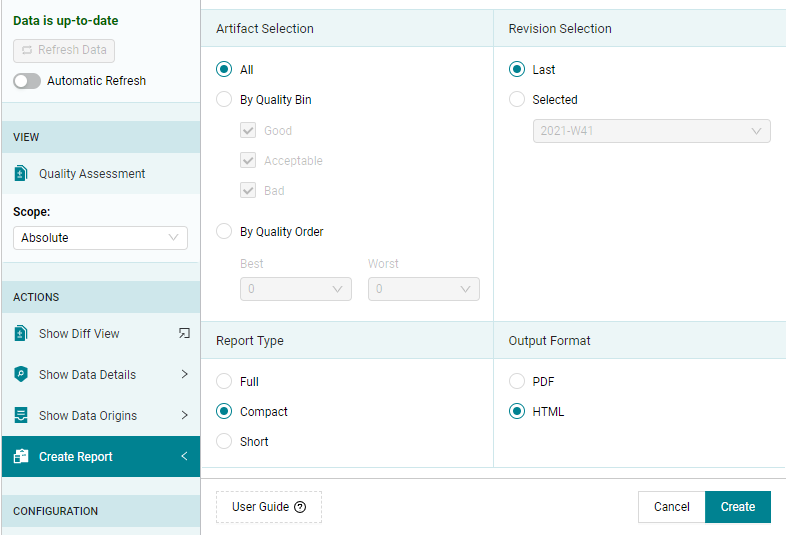
Figure 23.1 The dialog allows the configuration of specific settings for the report.
23.1.1. Artifact selection
If you want to limit the artifacts contained in the report, MQC provides several use cases that can be configured in the following way:
- All: Include all artifacts in report
All artifacts are contained inside the status report. These artifacts are sorted from worst to best by default.
The following options allow users to limit those artifacts for which the status report will be generated.
First, MQC allows to select artifacts by Quality Bins. The options to be shown in the dialog depend on the current quality bin configuration (see Quality Model and Quality Bin Configuration). The following options are valid if the default bin configuration applies.
- By Quality Bin: Bad
Show only artifacts with severe quality problems, i.e. all your artifacts with at least one quality property with a very low quality value (marked in MQC in red) are added to your report.
- By Quality Bin: Acceptable and Bad
Show only artifacts with “yellow” and “red” quality, thus concentrating on results that must be improved considerably.
- By Quality Bin: Good and Acceptable
Show only artifacts with “green” and “yellow” quality, thus concentrating on artifacts with at least acceptable quality.
- By Quality Bin: Acceptable
Show only artifacts with a “yellow” quality, i.e. all your artifacts with at least one quality property with a calculated quality value which ranges from 20 to 80.
- By Quality Bin: Good
Show only artifacts with a “green” quality, i.e. all your artifacts that are already quite good.
Additionally, MQC allows to select artifacts by Quality Order.
- By Quality Order: Best “x” and worst “y” (artifacts)
Show the “x” artifacts with the best and “y” artifacts with the worst aggregated quality at the same time. You can compile your artifacts in such a way that the desired amount of artifacts with the best and/or worst quality can be exported within your report.
- By Quality Order: Worst 5 (artifacts)
Show only a given number (e.g. 5) of worst artifacts (by quality). This option allows you to create a report with a stable number of worst (or best) artifacts regardless of its classification according to the aforementioned Quality Bins (e.g. Good, Acceptable, and Bad).
Furthermore, in case you have to take control of a huge amount of artifacts we recommend combining the functionalities within the Status Report generation with the wide range of possibilities provided by the filter panel. For example, given the case that you have defined an Artifact Structure (see Artifact Structure), you will be able to create a report with specific (e.g. Good, Worst, Best, Acceptable, etc.) artifacts of only one (or multiple) StructureGroups or StructureElements.
23.1.2. Revision selection
A status report is for exactly one revision. The last revision is selected by default, but any other revision can be chosen in this dialog. Please, note that trend charts will appear in the status report for the whole project duration (or the filtered duration/revisions according to the filter panel).
23.1.3. Report Type
Three different report types are available to choose from: Full, Compact, and Short. Every report type displays relevant data and visualizations of the following categories.
Full |
Compact |
Short |
|
|---|---|---|---|
Quality Overview |
✓ |
✓ |
✓ |
Data Availability Overview |
✓ |
✓ (*) |
✓ (*) |
Data Trend Overview |
✓ |
- |
- |
Data Status Overview |
✓ |
- |
- |
Artifact Details |
✓ |
✓ |
- |
Quality Property Details |
✓ |
✓ |
- |
User Configured Custom Pages |
✓ |
✓ |
✓ |
Configuration Information |
✓ |
- |
- |
Annotations |
✓ |
✓ |
- |
* Does not contain the “Missing Base Measures per Artifact” table.
23.1.4. Output Format
You can chose between two different output formats namely PDF or HTML.
After clicking on Create the report will open within the default viewer on your platform, where you can save it from.
23.2. Content of the report
23.2.1. Report and Project Information
The Report Information shows the configurations of the report and the creation date. In addition it contains the project name, information regarding the due date of your milestones, the overall availability value and overall quality value.
The Project Information is a summary of the project for the selected revision.
23.2.2. Quality Overview
This section contains the most important visualizations and information of the quality pages in MQC, such as the Quality Distribution, Quality Status for the selected revision, Quality Trend by Artifact and the Quality Trend by Property.
Additionally, quality status information for the selected revision per Artifact as well as per Quality Property are available in tables.
23.2.3. Data Availability Overview
In the Data Availability Overview the Availability Distribution shows the data availability over time.
The Availability Matrix and the Availability Status is shown only for the selected revision of the report.
Special attention is paid to missing data. Not yet imported base measures are listed per artifact and data source. Please note, this information is included only when the report type “Full” is selected.
23.2.4. Data Trend Overview
For the Data Trend Overview the measure trend by artifact visualizations present the base measure values per artifact across all revisions.
23.2.5. Data Status Overview
The Data Status Overview provides a data status visualization for each data source for the selected revision.
23.2.6. Artifact Details
The Artifact Details section shows, per artifact, the Quality Trend as well as the Quality Status for all quality properties. The Quality Status is only shown for the selected revision.
Additionally a table for the selected revision with the quality property values is included, which can also be used to directly navigate to the corresponding part of the Quality Property Details.
23.2.7. Quality Property Details
The Quality Property Details section shows the Quality Trend by Artifact as well as the measurement function, which is used to calculate the quality from the imported data for each quality property.
Additionally a table is shown that displays the data for all measures inside the measurement function for each artifact, as well as the file source from which the data was read. The table cells inside this table are either displayed white for available, blue for propagated or grey for missing.
Much like in the Artifact Details, this table can be used to directly navigate to the corresponding part of the Artifact Details section.
23.2.8. User Configured Custom Pages
The user configured custom pages are dependent on the configured pages in MQC (for more details refer to Custom Pages). The status and trend visualizations for each page are shown.
23.2.9. Configuration Information
This section provides an overview for all imported configurations divided into Quality Configurations, Structure Configurations and Other Configurations.
The Quality Configurations include:
the Quality Model Configuration
the Actions Configuration
the Derived Measure Configuration
the Base Measure Configuration
the Context Categories Configuration
the Quality Bin Configuration.
The Structure Configurations include:
the Project Milestone Configuration
the Artifact Structure Configuration (incl. Context Categories and Artifact Mapping).
Other Configurations include the user configured Custom Page Configuration.
23.2.10. Annotations
The Annotations section contains all Annotations that are valid for the selected revision. The Annotations are grouped by Artifact.