14. Quality Model Configuration
As described in Quality Concept, MQC handles the imported data in such a way that quality can be structured and computed out of it. You can configure the quality model by importing one or multiple Quality Model Sources, which can have the YAML or Excel format. These files include the definition of measurement functions to calculate measures for quality properties as well as the definition of base measures and derived measures.
14.1. Importing Quality Model Sources
To import a Quality Model Source into your project, press the Add
button next to in the
dialog (see Figure 14.1).
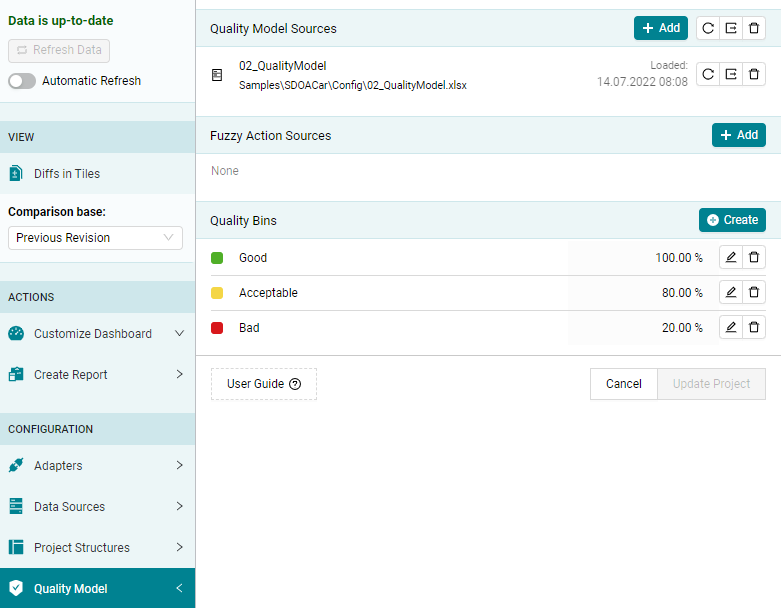
Figure 14.1 Import one or multiple Quality Model Sources
MQC allows to import multiple Quality Model Sources. By that it is possible to define measures and quality properties for each data source in its own Quality Model Source.
When adding a new Quality Model Source, the content is validated for consistency and, additionally, it is checked for conflicts against the already existing Quality Model configuration defined by the previously added files.
All changes done via the dialog will be applied
to the project first after pressing the Update Project button.
Note
If you do not have a proper Quality Model Source that can be adapted, you can export one of the currently imported Quality Model Sources (see Exporting Quality Model Sources) and use it as a template in which you define your own project’s quality model.
Please, check the Quality Model Source schema, to get an overview about all expected and optional parameters when writing Quality Model Sources in YAML format.
It is possible to reload or remove each Quality Model Source individually as well as all source files at once.
MQC already provides data source specific Quality Model configurations. These predefined Quality Model configurations can be directly chosen via the “Suggestions” tab within the dialog (see Figure 14.2).
Additionally, MQC uses these Quality Model Sources if no Quality Model at all was added by the user. In this case MQC recognizes the data sources used from the data currently imported and loads the corresponding provided initial quality models.
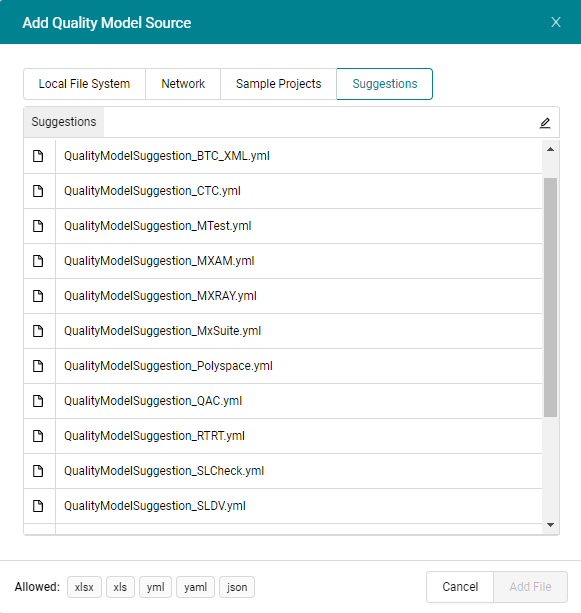
Figure 14.2 Predefined Quality Models per data source shipped with MQC
14.2. Exporting Quality Model Sources
In the dialog MQC allows to export each Quality
Model source file individually by pressing the Export button next to a
Quality Model source in the list of source files
(see Figure 14.1).
This will directly export a Quality Model Source of the file type is was
originally imported in.
If you would like to merge the Quality Model configurations from multiple
imported source files into a single Quality Model Source, press the
Export button next to Add at the top. This opens an additional
dialog as shown in Figure 14.3.
With this it is possible to select the relevant source files to be combined.
Additionally, this dialog provides the option to explicitly choose the file type of the export.
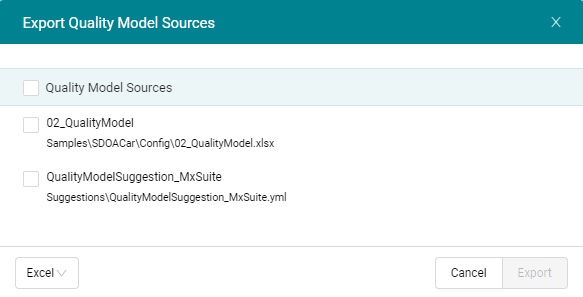
Figure 14.3 Export dialog for exporting multiple Quality Model sources
14.3. Configuration Details
14.3.1. Base Measures and Default Values
Base Measures are the imported values provided by your data sources. As described later in Derived Measures and Quality Properties, base measures are used to calculate other measures, so-called derived measures, and – most important – quality values, which are the base to compute quality.
For configuring base measures, MQC expects the following structure:
data source name
(default) measurement name
base measure name
variable name
default value
The data source is the tool, which is used to provide data to be imported into MQC. Examples are MXAM and MTest.
Typically, a measurement means the set of operations done to determine the value for a measure. For example this can be the name of a specific guideline document, which is used for the static analysis of a model, or the kind of test environment like MiL, SiL or PiL.
If a tool adapter supports the possibility to provide measurement names out of data files, the default is ignored and MQC uses the name provided by the tool adapter/data file.
Without default values, in case there are values missing for variables inside such a base measure group for a certain revision, a measurement function using these missing base measure variables could not be calculated. Therefore, MQC uses a configured default in case the data source has provided values for some base measure variables of a base measure group but not for all.
As an example, please imagine the base measure group FindingCount, which
contains the variables Canceled, Aborted, Review, Failed,
Unrepaired, Warning, Info, Repaired, Passed and
Ignored. If for a certain revision the data source does not provide values
for e.g. Repaired and Passed, MQC uses the default values for the
related base measure variables as defined in the Quality Model source. Hence, a
corresponding measurement function can be calculated.
BaseMeasures:
- Name: MXAM.GuidelineAnalysis.FindingCount.Aborted
  DefaultValue: 0
- Name: MXAM.GuidelineAnalysis.FindingCount.Canceled
  DefaultValue: 0
- Name: MXAM.GuidelineAnalysis.FindingCount.Failed
  DefaultValue: 0
- Name: MXAM.GuidelineAnalysis.FindingCount.Info
  DefaultValue: 0
- Name: MXAM.GuidelineAnalysis.FindingCount.Passed
  DefaultValue: 0
- Name: MXAM.GuidelineAnalysis.FindingCount.Repaired
  DefaultValue: 0
- Name: MXAM.GuidelineAnalysis.FindingCount.Review
  DefaultValue: 0
- Name: MXAM.GuidelineAnalysis.FindingCount.Unrepaired
  DefaultValue: 0
- Name: MXAM.GuidelineAnalysis.FindingCount.Warning
  DefaultValue: 0
- Name: MXAM.GuidelineAnalysis.FindingCount.Ignored
  DefaultValue: 0
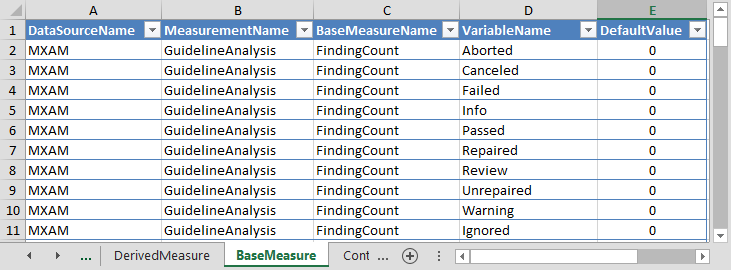
Figure 14.4 Defining expected base measures with there default values in Excel
Note
Please note, that all the expected base measure variables have to be defined in the Quality Model sources. This is to assure that missing values can be substituted with the default values.
In addition, MQC uses default values only if a base measure variable inside a base measure group is missing! If the complete base measure is missing for a revision, no default values will be used!
In the case when base measures are completely missing in the current revision but values exist for any of the previous revisions, data propagation may be used to gain a full set of available information (see Data Propagation).
14.3.2. Derived Measures
Derived measures are computed either from base measures or from other derived measures as explained in Derived Measures.
This may be used to shorten the definition of measurement functions, which compute quality values for quality properties (see Quality Properties).
A fully qualified derived measure name consists of four parts (same structure as for base measures):
data source name
measurement name
derived measure name
variable name
With that you are able to define groups of derived measures, each group containing multiple variables.
The configuration of data source name and measurement name is optional. If nothing is set here (short notation), MQC takes data source and measurement from the base and/or derived measures used to calculate the derived measure.
DerivedMeasures:
- Name: GuidelinesCalc.Passed
  Expression: '[GuidelineCount.Passed]+log(1+[FindingCount.Passed],2)'
- Name: GuidelinesCalc.Repaired
  Expression: '[GuidelineCount.Repaired]+log(1+[FindingCount.Repaired],2)'
- Name: GuidelinesCalc.Unrepaired
  Expression: '[GuidelineCount.Unrepaired]+log(1+[FindingCount.Unrepaired],2)'
- Name: GuidelinesCalc.Failed
  Expression: '[GuidelineCount.Failed]+log(1+[FindingCount.Failed],2)'
- Name: GuidelinesCalc.Info
  Expression: '[GuidelineCount.Passed with Infos]+log(1+[FindingCount.Info],2)'
- Name: GuidelinesCalc.Review
  Expression: '[GuidelineCount.Review]+log(1+[FindingCount.Review],2)'
- Name: GuidelinesCalc.Warning
  Expression: '[GuidelineCount.Warning]+log(1+[FindingCount.Warning],2)'
- Name: GuidelinesCalc.AbortedCanceled
  Expression: '[GuidelineCount.Aborted]+[GuidelineCount.Canceled]'
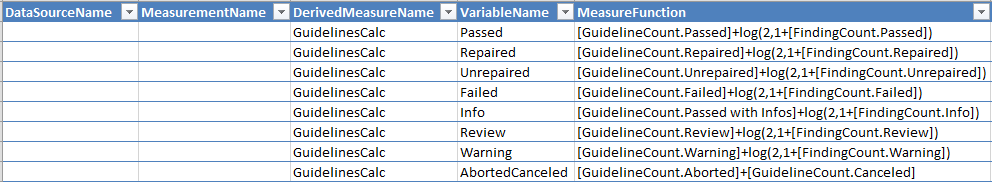
Figure 14.5 Defining derived measures using a short notation (derived measure name and variable name only) in Excel
Listing 14.2 shows the
definition of several derived measures that are computed from various
variables of the base measures FindingCount and GuidelineCount
provided by the data source MXAM. For example, the derived measure
GuidelinesCalc.Passed is calculated by the following measure function:
[GuidelineCount.Passed] + log(2, 1 + [FindingCount.Passed])
Note
As shown in the above example, base and derived measures used in a measure
function must be set in square brackets [ and ]!
If measure functions are defined using a short notation for measure names only consisting of base / derived measure name and variable name (see Listing 14.2), MQC checks for matching measures that were imported and replaces the used measure names by the fully qualified names.
If a measure function contains a base measure that exists for different
measurements, for example if FindingCount.Passed was measured multiple
times by checking compliance according to different guideline documents, MQC
calculates the corresponding derived measure for each of these measurements.
The same applies to measure functions containing derived measures calculated
for multiple measurements.
Note
If a derived measure is calculated for multiple measurements, the configured data source and measurement names will be replaced by data source and measurement from the base and/or derived measures used to calculate the derived measure.
To calculate a derived measure for a selected measurement only, please, use fully qualified measure names when defining the measure function.
14.3.3. Quality Properties
Quality properties are the lowest level of computable quality. For each quality property a measurement function has to be defined that is used to calculate a quality value between 0 and 1 by using base and derived measures.
Derived measures (see Derived Measures) can be used instead of base measures to simplify quality computation, hence, to shorten the formula of a particular measurement function.
Listing 14.3 shows an
example for a measurement function, where all base measure variables for the
base measures FindingCount and GuidelineCount were replaced by the
defined derived measures.
Optionally, for a quality property you can define actions, which are recommended tasks for improving the corresponding quality property value. For detailed information about Actions in MQC please refer to chapter Actions.
QualityProperties:
- Name: Guideline Compliance
  Weight: 1
  Expression: (1.0*([GuidelinesCalc.Passed]+[GuidelinesCalc.Info]+[GuidelinesCalc.Repaired])
              + 0.8*[GuidelinesCalc.Warning] + 0.5*[GuidelinesCalc.Unrepaired]
              + 0.2*[GuidelinesCalc.Failed] + 0.1*[GuidelinesCalc.Review]
              + 0.0*[GuidelinesCalc.AbortedCanceled])
              / ([GuidelinesCalc.Passed] + [GuidelinesCalc.Info] + [GuidelinesCalc.Repaired]
              + [GuidelinesCalc.Warning] + [GuidelinesCalc.Unrepaired] + [GuidelinesCalc.Failed]
              + [GuidelinesCalc.Review] + [GuidelinesCalc.AbortedCanceled])
  Actions:
  - Refactor model according to guideline findings
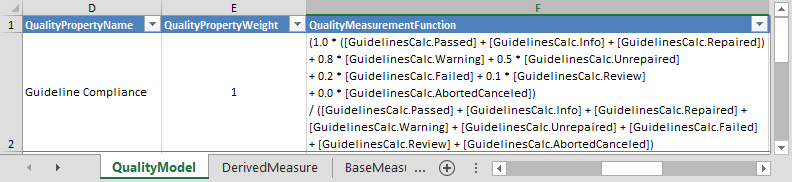
Figure 14.6 Quality Property definition in Excel (without Action definition)
Note
In Excel you will have to define the actions separately in the Action-List sheet (see Figure 14.7).
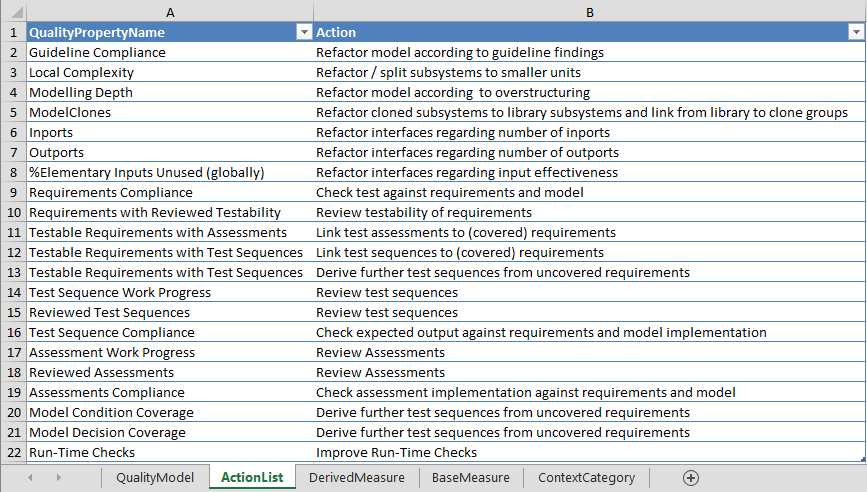
Figure 14.7 Defining recommended actions for improving quality properties in Excel
As for measure functions to calculate derived measures, you can define quality property measurement functions using a short notation for measure names consisting of base / derived measure name and variable name. MQC then checks for matching measures that were imported (base measures) or calculated (derived measures) and replaces the used measure names by the fully qualified names.
Note
As shown in the above example, base and derived measures used in a
measurement function must be set in square brackets [ and ]!
If a measurement function uses a base or derived measure that exists for
different measurements, for example if GuidelinesCalc.Passed was calculated
multiple times, MQC calculates the corresponding quality property for each of
the measurements.
Note
If a quality property is calculated for multiple measurements, the configured
quality property name will be extended by the name of the measurement, e.g.
Guideline Compliance (GuidelineAnalysis), whereas Guideline Compliance
is the defined quality property name and GuidelineAnalysis is the name
of the measurement.
To calculate a quality property for a selected measurement only, please use fully qualified measure names when defining the measurement function.
14.3.4. Quality Model Structure
As explained in Quality Model Structure, quality in MQC is aggregated on different levels (as shown in Figure 6.4). MQC allows to assign quality properties to quality structures (see Figure 14.8). This enables the user to group quality properties in order to define different quality aspects, which may be analyzed separately.
QualityStructures:
  - Name: Quality Structure
    Path: Models.Characteristics.Subcharacteristics
QualityProperties:
  - Name: Requirements Compliance
    Weight: 3
    Expression: '[Requirements Compliance.Reached] / [Requirements Compliance.Total]'
    Structures:
      - Path: Models.Characteristics.Subcharacteristics
        Value: Product Quality Model.Correctness.Functional Requirements
  - Name: Requirements with Reviewed Testability
    Weight: 0.25
    Expression: '[Requirements with Reviewed Testability.Reached] / [Requirements with Reviewed Testability.Total]'
    Actions:
      - Review testability of requirements
    Structures:
      - Path: Models.Characteristics.Subcharacteristics
        Value: Product Quality Model.Completeness.Functional Requirements
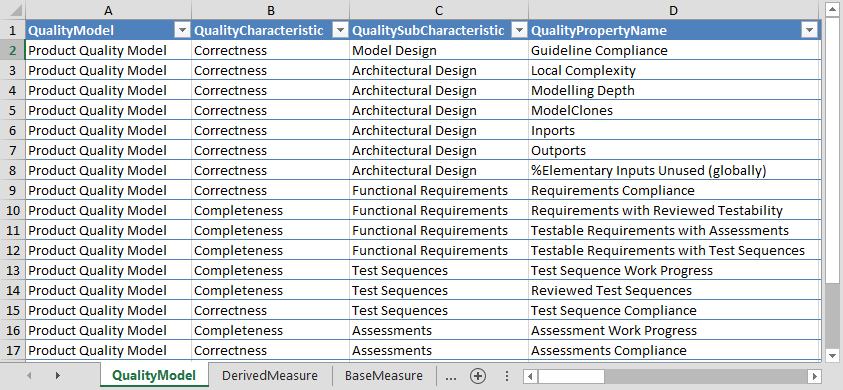
Figure 14.8 Definition of a quality model structure and assigning quality properties to this structure in Excel
Just like the artifact structures are used to group artifacts (see Artifact Structure), quality structures are used to group quality properties hierarchically. Defining such groups of quality properties offers you the possibility to filter the visualized data accordingly, e.g. to just focus on quality properties belonging to a certain group as well as to aggregate quality according to these groups.
The excel format allows for as many structure levels as needed or none at all. These levels can be defined as columns with a column name beginning with “Quality”. (e.g. ‘QualityCharacteristics’ for a “Characteristics” structure level or ‘QualitySubcharacteristics’ for a “Subcharacteristics” structure level). Structures defined within a Quality Model Source in the excel format, are automatically considered as one hierarchy, with the order of the columns defining the level (e.g. Models > Characteristics > Subcharacteristics).
The following sunburst visualization (Figure 14.9, lower right) illustrates the computation of the a quality model with three structure levels configured: Models, Characteristics and Subcharacteristics.
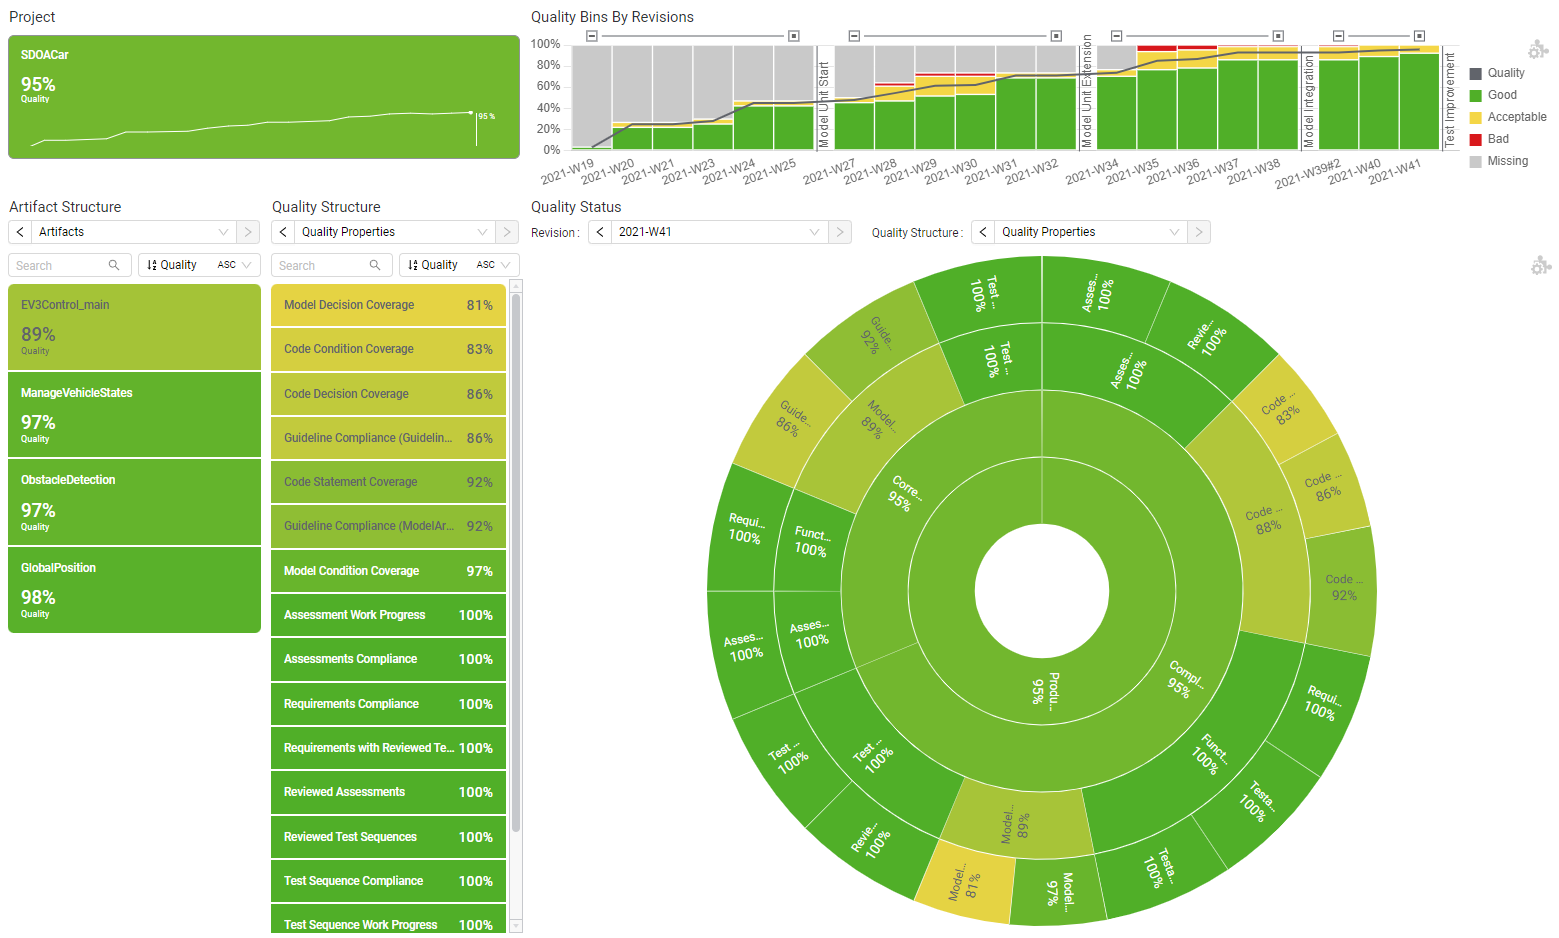
Figure 14.9 Computation of the overall quality illustrated using the sunburst visualization.
The outer ring of the sunburst consists of all quality properties defined by the quality model. Please note, each quality property is already aggregated over the artifacts (see Figure 6.6 in section Quality Aggregation).
The next ring shows the subcharacteristics defined by the quality model. A subcharacteristic is calculated using the average of all quality properties assigned to that subcharacteristic.
The third ring of the sunburst chart shows the configured characteristics. Each characteristic is calculated using the average of all quality properties assigned to all subcharacteristics belonging to that particular characteristic.
Finally, the inner circle shows the overall quality.
Note
By default, MQC uses all quality properties to compute the separate levels of the quality model, even if the measure value for a certain quality property cannot be calculated. This may be the case if all or a few measures, which are used to compute a quality property measurement function, are not available within a certain revision, i.e. not yet measured.
Missing quality properties are always treated as 0 when calculating the overall quality of a project.
Multiple hierarchies can only be added by using the YAML or JSON formats. By following the schema definition, the Structures have to be defined first. Each quality property can then be assigned to one or multiple hierarchies. These hierarchies can have a different amount of levels. When assigning a structure hierarchy to a quality property, a structure element has to be provided for each defined level.
 QualityStructures:
   - Name: Functional Suitability
     Path: Models.Characteristics.Subcharacteristics
   - Name: Quality Assurance Methods
     Path: Quality Assurance.QA Method.QA Work Product
 QualityProperties:
   - Name: Requirements Compliance
     Structures:
       - Path: Models.Characteristics.Subcharacteristics
         Value: Product Quality Model.Correctness.Functional Requirements
       - Path: Quality Assurance.QA Method.QA Work Product
         Value: Product Quality Model.Test.Requirements
   - Name: Requirements with Reviewed Testability
     Structures:
       - Path: Models.Characteristics.Subcharacteristics
         Value: Product Quality Model.Completeness.Functional Requirements
       - Path: Quality Assurance.QA Method.QA Work Product
         Value: Product Quality Model.Test.Requirements
   - Name: Testable Requirements with Assessments
     Structures:
       - Path: Models.Characteristics.Subcharacteristics
         Value: Product Quality Model.Completeness.Functional Requirements
       - Path: Quality Assurance.QA Method.QA Work Product
         Value: Product Quality Model.Test.Requirements
   - Name: Testable Requirements with Test Sequences
     Structures:
       - Path: Models.Characteristics.Subcharacteristics
         Value: Product Quality Model.Completeness.Functional Requirements
       - Path: Quality Assurance.QA Method.QA Work Product
         Value: Product Quality Model.Test.Requirements
In the example shown in Figure 14.9 all quality properties defined by the quality model are treated equally. This means they have the same weight when computing the overall quality of a project. Nevertheless, MQC allows to give some quality properties a higher importance than others. This relative importance can be defined in the Quality Property weight.
Each level of the quality model will use the weighted average for quality computation.
14.3.5. Context Categories
By using context categories you can define, which data (on the level of base measures) is expected for a certain artifact. In that way, data never provided and therefore normally stated as “missing” - and probably resulting in bad quality - is treated as “excluded” data. This means it is excluded in availability and quality calculation.
Configuration of context categories is done in two steps:
assigning data to (or explicitly removing from) a context category is done within the Quality Model source, because this is directly related to the base measures defined here
assigning context categories to artifacts is done in the project structure configuration file, where the expected artifacts are defined (see Assign Context Categories to Artifacts)
For each context category you can define, which data is expected (white list) respectively which data should be excluded (black list). A combination of both is possible (see Figure 14.10).
ContextCategories:
- Name: StaticAnalysisOnly
  Expect: MXAM, MXRAY
- Name: TestNoCoverage
  Expect: MXAM, MXRAY, MTest
  Exclude: MTest.*.Model*Coverage
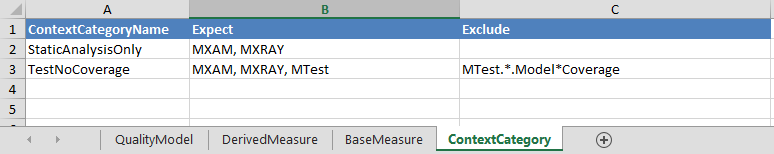
Figure 14.10 Configuring context categories in Excel
Expected as well as excluded data has to be defined using comma-separated lists of data sources, measurements and/or measures. Use either the full name or name patterns (including wildcards).
In the given example two context categories are defined. The first one only
includes all data from MXAM and MXRAY. For the second context category MTest is
configured as additional data source, but without the two measures Model
Condition Coverage and Model Decision Coverage.
Note
If you leave the “Expect” field empty, all data is expected for that context category. To state that no data is expected at all, use the key word “none”.
If the “Exclude” field is left empty, this means nothing is excluded, but still, the amount of data may be reduced by specifying expected data.
For a detailed explanation how to use context categories, please refer to chapter Context Categories.
14.4. Quality Model for MES data sources
14.4.1. Quality Model for MXAM
In section Quality Properties there were already examples shown, how to define derived measures and quality properties, as well as a measurement function using measures provided by MXAM.
The defined derived measures are calculated using both, guideline results
(GuidelineCount) as well as check findings (FindingCount). Because of
the fact that the amount of check results typically is much higher than the
number of the guideline results, we use a log function to reduce the
impact of the check findings.
GuidelinesCalc.Passed = [GuidelineCount.Passed] + log(1 + [FindingCount.Passed], 2)
The MXAM quality model contains derived measures for all possible results, i.e.
Failed, Info, Warning and so forth.
These derived measures are used in the measurement function for the quality
property Guideline Compliance, which is defined as follows:
(1.0 * ([GuidelinesCalc.Passed] + [GuidelinesCalc.Info] + [GuidelinesCalc.Repaired]) +
0.8 * [GuidelinesCalc.Warning] +
0.5 * [GuidelinesCalc.Unrepaired] +
0.2 * [GuidelinesCalc.Failed] +
0.1 * [GuidelinesCalc.Review] +
0.0 * [GuidelinesCalc.AbortedCanceled]) /
([GuidelinesCalc.Passed] + [GuidelinesCalc.Info] + [GuidelinesCalc.Repaired] +
[GuidelinesCalc.Warning] + [GuidelinesCalc.Unrepaired] + [GuidelinesCalc.Failed] +
[GuidelinesCalc.Review] + [GuidelinesCalc.AbortedCanceled])
As you can see, the measurement function calculates the weighted average of all derived measures.
There are two additional MXAM derived measures defined.
IssueCount.Value which is the sum of all “bad” findings, i.e.
FindingCount.CanceledFindingCount.AbortedFindingCount.ReviewFindingCount.FailedFindingCount.UnrepairedFindingCount.Warning
SevereIssueCount.Value which is the sum of all “bad” findings not
considering FindingCount.Warning.
14.4.2. Quality Model for M-XRAY
The MXRAY quality model contains quality properties based on base measures provided by the data source M-XRAY.
As an example, the measurement function for Local Complexity is defined as
follows:
(1.0 * [Local Complexity.Good] +
0.8 * [Local Complexity.Acceptable] +
0.2 * [Local Complexity.Bad]) /
([Local Complexity.Good] + [Local Complexity.Acceptable] + [Local Complexity.Bad])
The same pattern may be used for Modelling Depth, Level, Inports,
Outports as well as for %Elementary Inputs Unused (globally).
14.4.3. Quality Model for MTest
The MTest quality properties are defined by comparing current and expected
results, which leads to quite simple measurement functions, e.g. the quality
property Requirements with Reviewed Testability is calculated as follows:
[Requirements with Reviewed Testability.Reached] / [Requirements with Reviewed Testability.Total]
Following this pattern, the MTest quality model additionally defines quality properties for:
Requirements ComplianceTestable Requirements with AssessmentsTestable Requirements with Test SequencesTest Sequence Work ProgressReviewed Test SequencesTest Sequence ComplianceAssessment Work ProgressAssessments ComplianceandReviewed Assessments.
14.5. Measurement function definition
This section aims to give you an overview on how to define your own quality properties or adapt your measurement functions.
You can use a bunch of mathematical functions provided within MQC.
Apart from the four basic arithmetic operations (+, -, * and
/), MQC allows to use: Abs, Exp, Ceiling, Floor, Round,
Ln, Log, Mod, Power, Product, Sqrt, Min, Max,
Avg, WeightedAverage, Case... when and IF... else.
In the following some of these functions are explained with their possible usage within a measurement function.
We already have seen
Log (2, n):Given the case you only have at your disposal certain base measure values, for that your quality property calculation tends to converge to 1 using basic arithmetic operations. Here you might consider to use Log function with basis 2 (please see the derived measure calculation in the example above Quality Model for MXAM.)
Note
For MQC 5.0 and lower, the log function is defined as log (n, 2).
Given the case that you want to avoid negative values in your measurement function, you can handle this at any time of its calculation using the
Abs-function, that returns the absolute value of the argument.
Abs([GuidelinesPassedCalc] - [GuidelinesInfoCalc])
or
Case... when:
case
  when ([GuidelinesPassedCalc] - [GuidelinesInfoCalc] < 0) then 1
  when ([GuidelinesPassedCalc] - [GuidelinesInfoCalc] > 0) then ([GuidelinesPassedCalc] - [GuidelinesInfoCalc])
  else 0
end
Powerreturns Arg1 raised to the Arg2 power.
Power(Arg1, Arg2)
ExpAnother useful application of mathematical functions could be the case of using the
Exp (argument)function, which returns e raised to the power of the argument.A linear function, such as in the first example (see below) might not be feasible to accurately adapt the Quality Property of ModelClones to your needs. Therefore, the second example shows a better function:
1.0 - ([ModelClones.Clones] / [ModelClones.Subsystems])
1.0 / Exp( 2 * [ModelClones.Clones] / [ModelClones.Subsystems])
AvgThis function calculates the average (mean) value of the input parameters:
Avg(parameter 1, parameter 2, ..., parameter n)