20. Actions
MQC calculates quality measure values (see Quality Concept) using which the user gains an overview on the current quality of the project and is also able to find the reasons for bad quality.
Additionally, MQC helps the user to identify the next steps to resolve quality deficits by recommending actions, where an action is a specific task which can improve one or more quality properties for a specific artifact.
Each action gets a priority according to the corresponding quality property measure value (see section Priority Groups). These priorities are used to create a sorted list of actions per revision.
The list of actions can be checked at the Action List page (see Action List Page).
20.1. Definition of Actions
Actions to improve the quality properties may be defined in the Quality Model Excel file (see QP-actions). Here, the actions by default have a linear relationship to the related quality properties. For example, if a quality property has 80% quality then the respective action is assigned a priority of 20% and further assigned a priority group.
Besides the possibility to define a one-to-one relation between actions and quality properties, which means, one action directly improves a specific quality property, the following is possible, too:
define one action and assign it to multiple quality properties. For example, an action “Derive further test sequences from uncovered requirements” may improve the quality property “Testable Requirements with Test Sequences” as well as the “Model Condition Coverage”.
define multiple different actions and assign them to a single quality property. For example, the quality property “Testable Requirements with Test Sequences” may be improved by deriving further test sequences from the requirements (see above), but also by linking already existing but not yet linked test sequences to requirements (action “Link test sequences to (covered) requirements”).
MQC also provides the flexibility of defining more complex non-linear
relations between actions and quality properties with the help of fuzzy logic.
This can be done by defining fuzzy rules in an FML file (IEEE Std 1855-2016).
An FML file is the representation of a fuzzy system in the XML format. For
reference, a sample FML file, 07_FuzzyActionDefinition.xml, consisting of
action definitions for all the quality properties in the default Quality Model
can be found in the sample data in the MQC_ShowCase_vXX.zip which can be
found here.
In order to use the FML file it must be imported in addition to the
Quality Model (open the dialog in the
Configuration section of the menu and select the Load button below the
“FML (Fuzzy Actions)” section). After loading it, the actions defined in
the FML as well as the Quality Model can be seen in MQC. In case of duplicate
actions in the FML file and the Quality Model, MQC considers the definition in
the FML file. At any point the FML file can also be removed from the project
by clicking the Remove button.
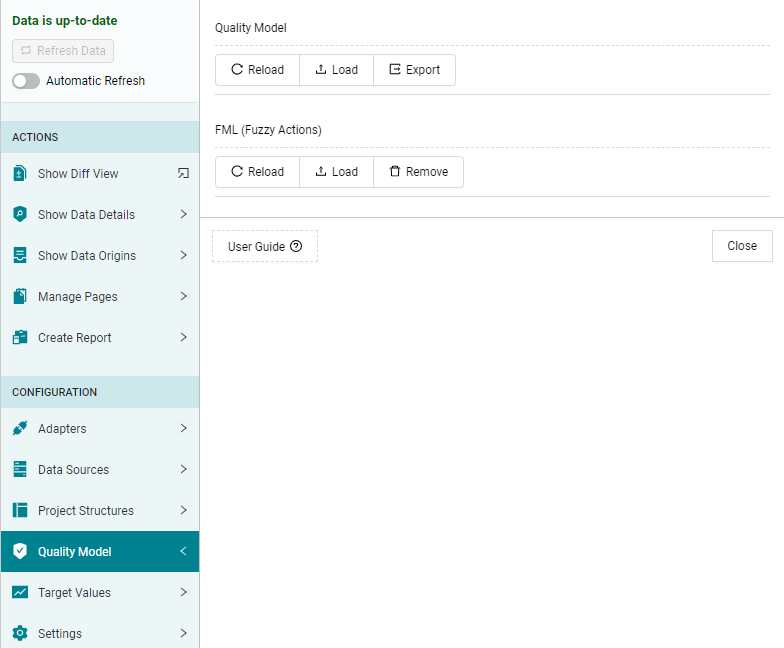
Figure 20.1 Load, Reload or Remove FML for action definition.
MQC already provides actions for the quality properties defined for the MES tools (i.e. MXAM, MXRAY and MTest) in the Default Quality Model (see Quality Model Configuration).
Note
In case the quality model contains a quality property without any assigned action (in the quality model or the FML), MQC assigns a default action “Improve …” followed by the name of the quality property.
Additionally, if the quality property does not have a calculated measure value for a revision then the respective action is replaced by another default action, “Start evaluation …” followed by the name of a quality property. This means that, the data to calculate that quality property has not yet been loaded into MQC.
20.2. Priority Groups
To create a sorted list of actions for multiple artifacts, each action gets a priority based on the corresponding quality property measure value.
MQC uses the following categories:
Very High
High
Moderate
Low
Very Low
An action with a priority “Very High” has be to executed in any case, whereas the one with priority “Very Low” can be postponed until all other more urgent actions have been performed.
For example, if a quality property has a value of 5 % for a specific artifact, the quality must be improved, therefore the corresponding action gets a “Very High” priority. If the calculated quality property measure value is already 90 %, it still can be improved, but there may be other tasks (worse quality) to be executed before, and the corresponding action gets a priority “Very Low”.
These priorities can be influenced by defining specific artifact weights and quality property weights. By that, an action for a certain artifact will get a higher priority, if the artifact is more important than other artifacts.
Note
Assigned priorities only define, if an action should be executed before another action based on the fact that one quality property has a relatively bad quality value than another.
A given priority does not say anything about the improvement impact of an action on the overall quality!
20.3. Action List Page
On the “Action List” page, you get an overview of the actions sorted by priority, which should be executed to improve the quality of your artifacts.
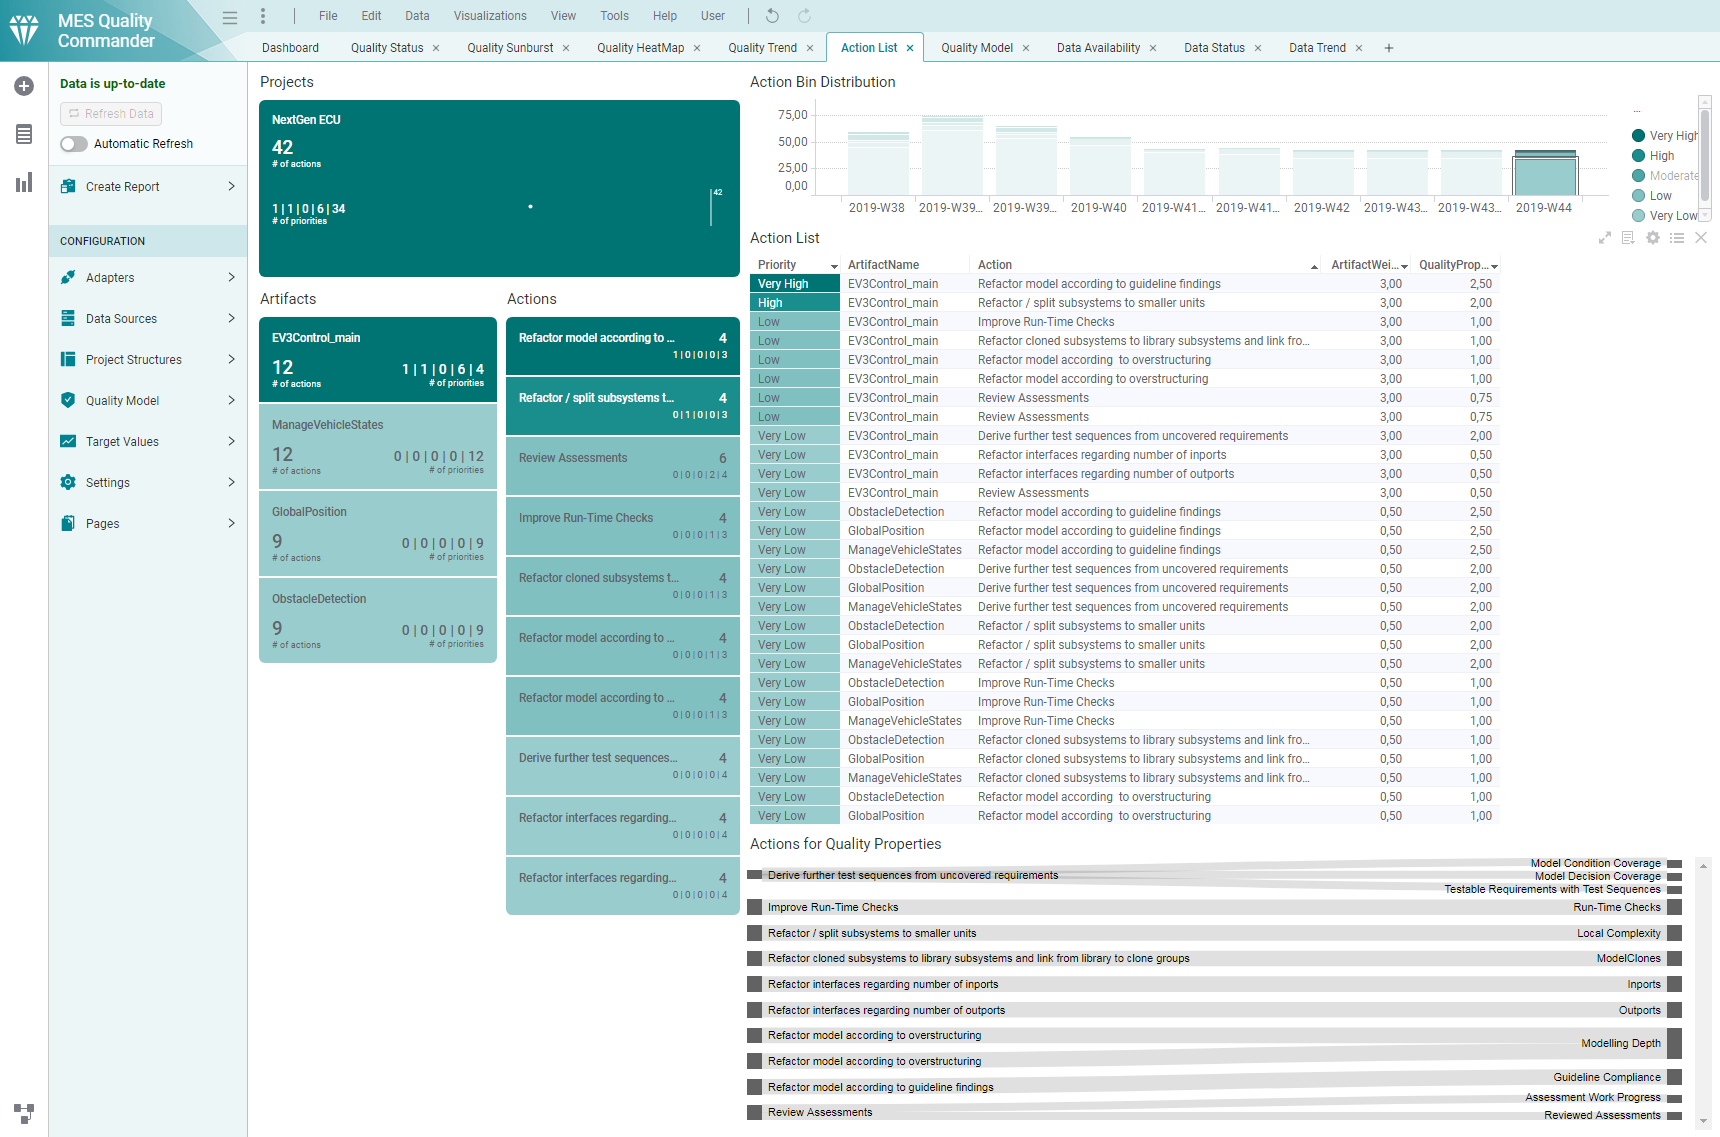
Figure 20.2 Action List page providing an overview on prioritized actions per revision.
To add this page, please check “Action List” under the ‘Action Pages’ section in the “Manage Pages” dialog of the MQC configuration menu (see Manage Pages).
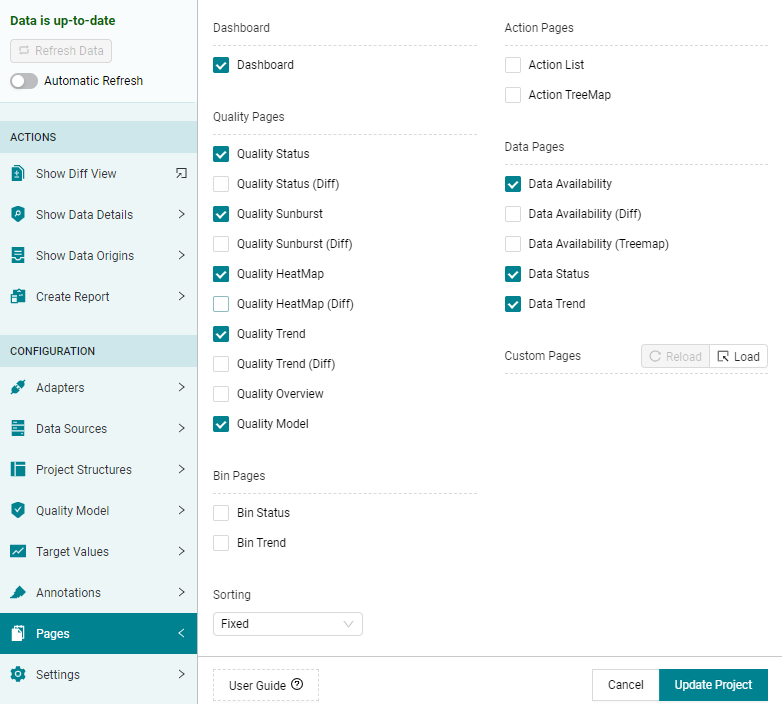
Figure 20.3 Add Action List page via the MQC configuration menu.
There are two main visualizations:
The “Action List” chart contains a list of all actions, where each action is to be executed for a particular artifact (see Figure 20.4). The list is sorted according to priorities. Within one priority category, e.g. “Very High”, actions are sorted according to artifact and quality property weights.
The “Actions for Quality Properties” chart presents the connections between the actions and the quality properties. This makes it easier to understand the origin of an action (see Figure 20.5). The action, “Derive further test sequences from uncovered requirements” is connected to three quality properties. Whereas, the quality property “Modelling Depth” affects two different actions.
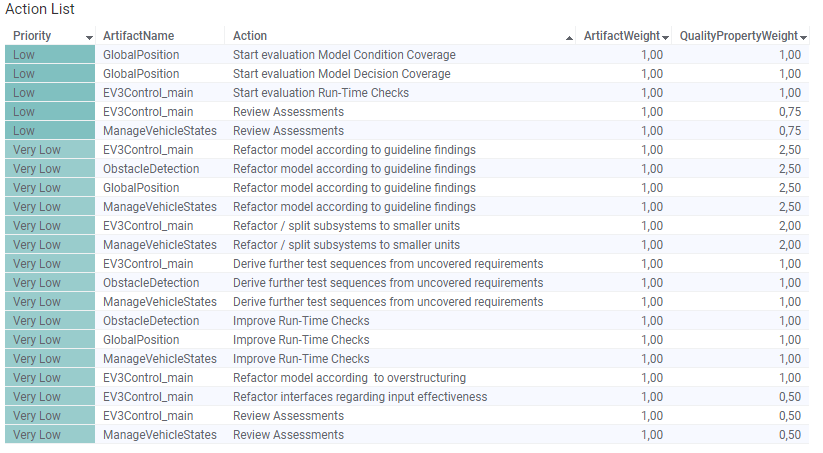
Figure 20.4 Ordered list of actions for selected revision
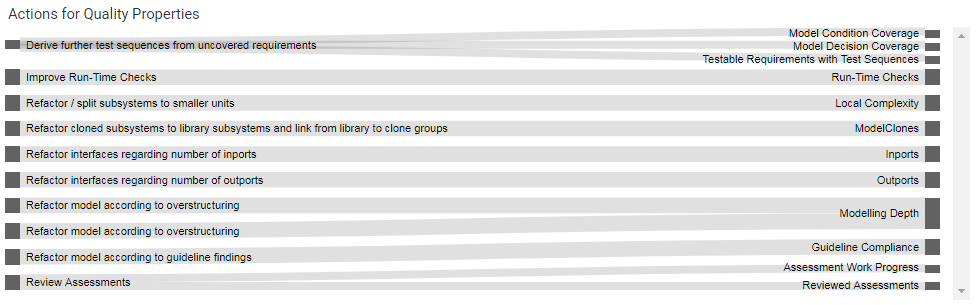
Figure 20.5 Actions for Quality Properties chart showing actions connected to the respective quality properties.
On the left-hand side of the page there are three KPI charts:
a Project KPI chart (at the top) showing the overall number of actions for the whole project
an Artifact KPI chart (left) showing the overall number of actions per artifact, sorted according to the number of actions
an Actions KPI chart (right) showing the number of artifacts this task has to be executed for
All KPIs show the number of actions in total and in each priority group for the whole project. Figure 20.6 shows that there are 21 actions overall from which 5 actions are of “Low” priority and 16 actions of “Very Low” priority.
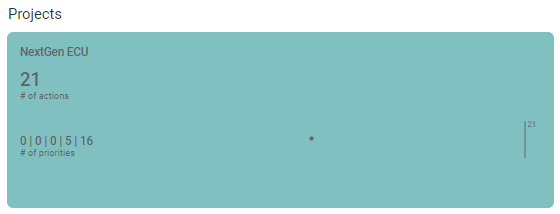
Figure 20.6 Project KPI chart showing the total number of actions for all artifacts and the action distribution according to priorities.
Finally, the “Action Bin Distribution” chart at the top-right of the page shows the action trend. Here you can find out the absolute number of actions per revision and how those numbers have been changed over time since your project started (see Figure 20.7). Additionally, at a glance you see the distribution of actions according to priority groups, means how many “Very High” actions are left compared to lower prioritized actions.
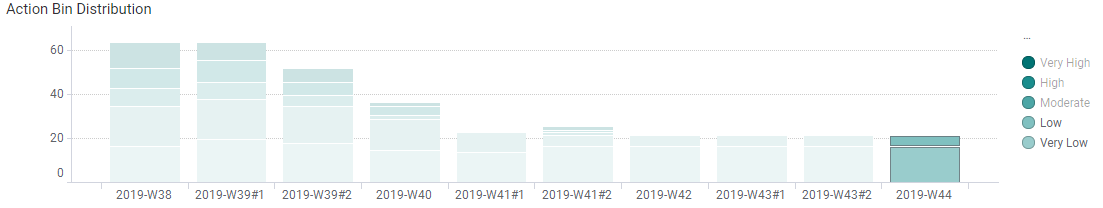
Figure 20.7 Action Bin Distribution chart.
Please note, that the last revision is pre-selected by default. Selecting another revision inside the distribution chart, shows the action list for a previous point time.