8. Actions and Configuration Menu
Per default the menu is enabled on all MQC pages. You can simply
switch it on or off by clicking the Menu icon within the MES Quality
Commander banner in the top-left.

Figure 8.1 Enable the menu within the MES Quality Commander banner
The MQC Menu is divided into Actions and the Configuration.
8.1. Actions
8.1.1. Refresh Data
Once you have configured Data Sources and imported data, you can gradually import your file reports by copying new files / directories into the configured directories. To consider your newly added files/directories, press the “Refresh” Button.
Each time you update Adapters configuration, to consider your changes (e.g. adding custom adapter or disabling base adapter), press the “Refresh” Button.
Alternatively, you can enable the Automatic Refresh checkbox, so that MQC refreshes the specified directories and files automatically when changes are detected.
MQC searches all configured files and subdirectories recursively to load new file reports into the collection of your analysis.
Changes inside the added directories (new files, removal of files or even changes within the files) are automatically detected.
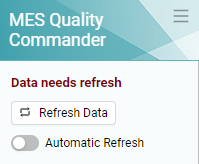
Figure 8.2 The “Needs refresh” status message appears due to changes within the monitored directories.
When clicking on the Refresh button the message will show to the “Data is up-to-date” status message, after the data has been refreshed.
8.1.2. Create Report
In this dialog you can create a Status Report (see Status Report).
8.1.3. Data of the Quality / Filtered by Quality
In this dialog you get a drill down from Quality to Data (see Data Details Drill Down).
8.2. Configuration
The bottom of menu contains all configurations of the analysis.
8.2.1. Adapters
In this dialog you manage adapters (see Custom Adapters).
8.2.2. Data Sources
Users can import either single files or directories by clicking on the Data Sources section and select files or directories that contain file reports, e.g. our example data that was delivered to you in section Quick Start Guide.
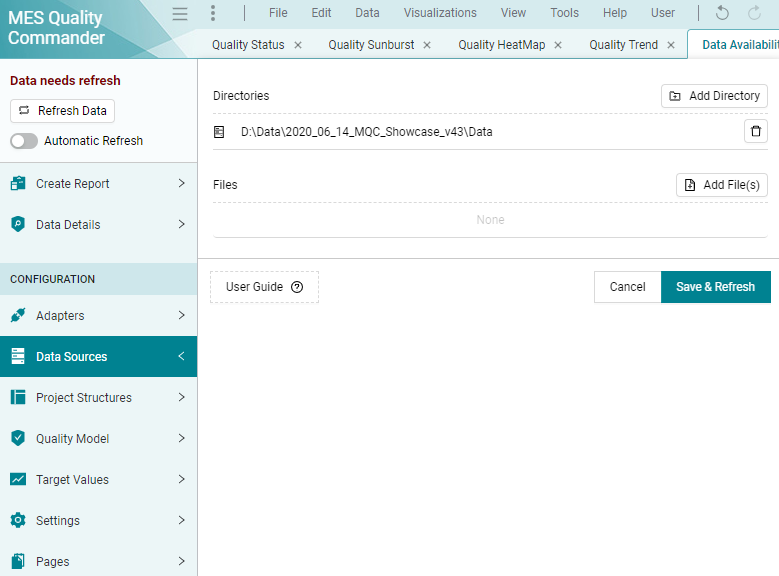
Figure 8.3 Configure Data Sources by adding files and/or directories
8.2.3. Project structures
Users can load, export or reload the Project Structures excel configuration (please refer to Project Structures Configuration for more information).
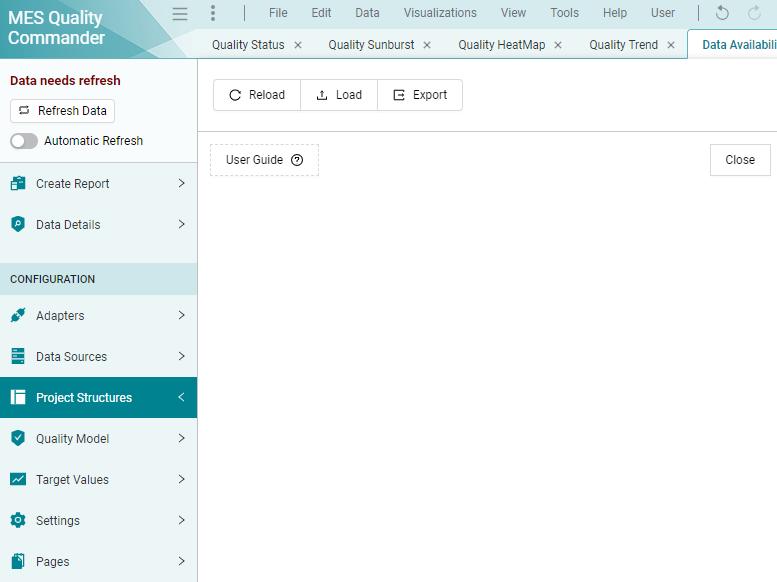
Figure 8.4 Configure Project Structures
8.2.4. Quality Model
Users can load, export or reload the Quality Model excel configuration. A default Quality Model is provided with MQC (please refer to Quality Model Configuration for more information).
8.2.5. Target Values
Users can load, reload or remove the Target Values excel configurations (please refer to Target Values for more information).
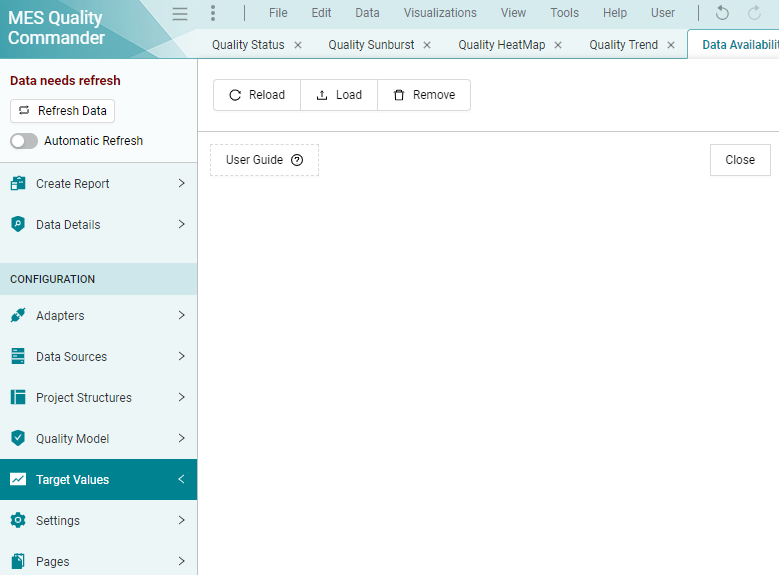
Figure 8.5 Configure Target values
Note
In the Project Structure, Quality Model and Target Values dialogs the Reload button is only visible when a configuration file has already been imported. A tooltip shows the paths to the currently loaded file.
8.2.6. Settings
This section contains a group of settings:
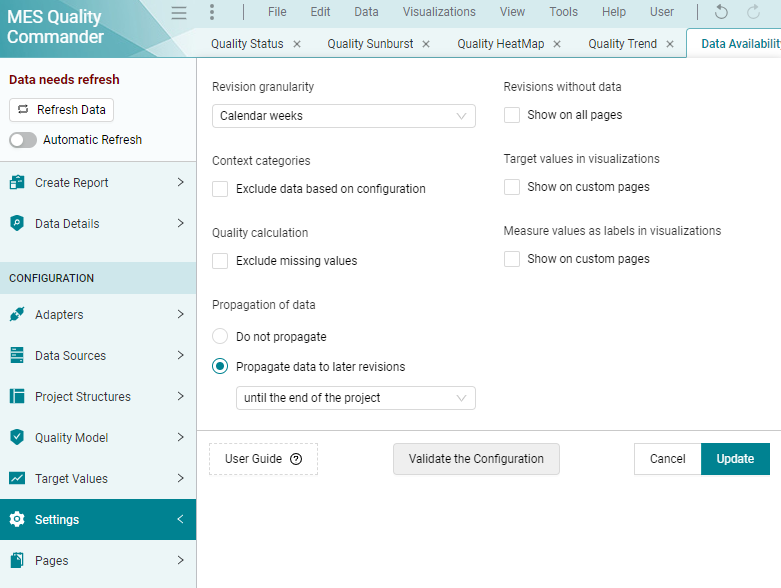
Figure 8.6 Settings dialog
8.2.6.1. Revision granularity
Can be used to change the degree of compactions of the revisions for which data exists to better visualize your trend line charts. The revision granularity can be selected depending on your needs (see Figure 8.7).
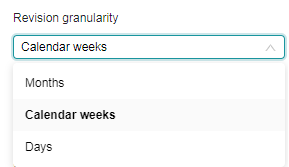
Figure 8.7 The default revision granularity is CalendarWeeks, but it might be useful to change it to Days or Months
8.2.6.2. Context Categories
8.2.6.3. Quality Calculation
(see Quality Properties)
8.2.6.4. Propagation of data
(see Data Propagation)
8.2.6.5. Revisions without data
8.2.6.6. Target values in visualization
8.2.6.7. Measure values as labels in visualizations
8.2.7. Pages
This section contains all pages that exist in MQC, categorized in four groups (Quality, Data, Tool and Custom pages). You can add or remove them by selecting or deselecting the checkboxes.
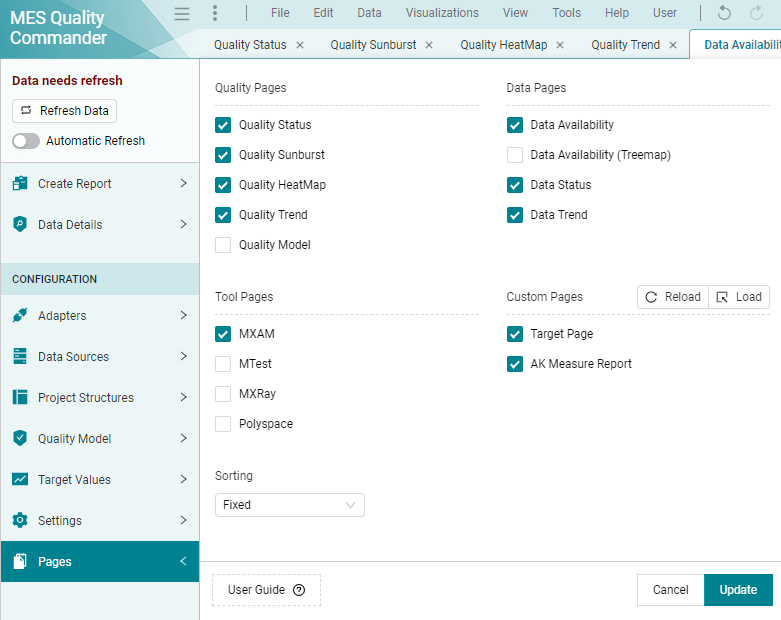
Figure 8.8 Pages dialog
Quality pages include Quality Status, Quality Sunburst, Quality HeatMap, Quality Trend, Quality Model pages.
Data pages include Data Availability, Data Status, Data Trend pages.
Tool pages include MXAM, MTest, MXRAY, Polyspace, which contains data from these data sources (see Tool Pages).
Custom pages: are defined in Custom Pages.
Sorting: there are two options for sorting pages (see Page order in the Pages dialog). By default the pages are in Fixed order. If Custom is selected for ordering, new pages are added after existing pages.
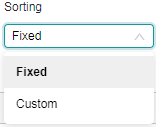
Figure 8.9 Page order in the Pages dialog
Note
To apply changes in the Settings and Pages dialogs you have to click
on the Update button.